Short Answer
Short Answer: Acoustic peaks are the periodic enhancements and suppressions in the temperature fluctuations of the cosmic microwave background (CMB), caused by sound waves that propagated through the dense baryon-photon fluid of the early universe. These peaks are the fossilized imprints of density perturbations that later grew into galaxies and clusters.
| Property | Value |
|---|---|
| Full Name | Acoustic (or Doppler/Sakharov) peaks |
| Location | Cosmic Microwave Background anisotropy power spectrum |
| Origin | Sound waves in the baryon-photon plasma before recombination |
| Epoch | From the Big Bang to ~380,000 years (recombination) |
| First Predicted | Peebles & Yu (1970); Sunyaev & Zeldovich |
| First Observed | BOOMERANG, MAXIMA, DASI (early 2000s) |
| Key Missions | COBE, WMAP, Planck |
Main Explanation
Definition
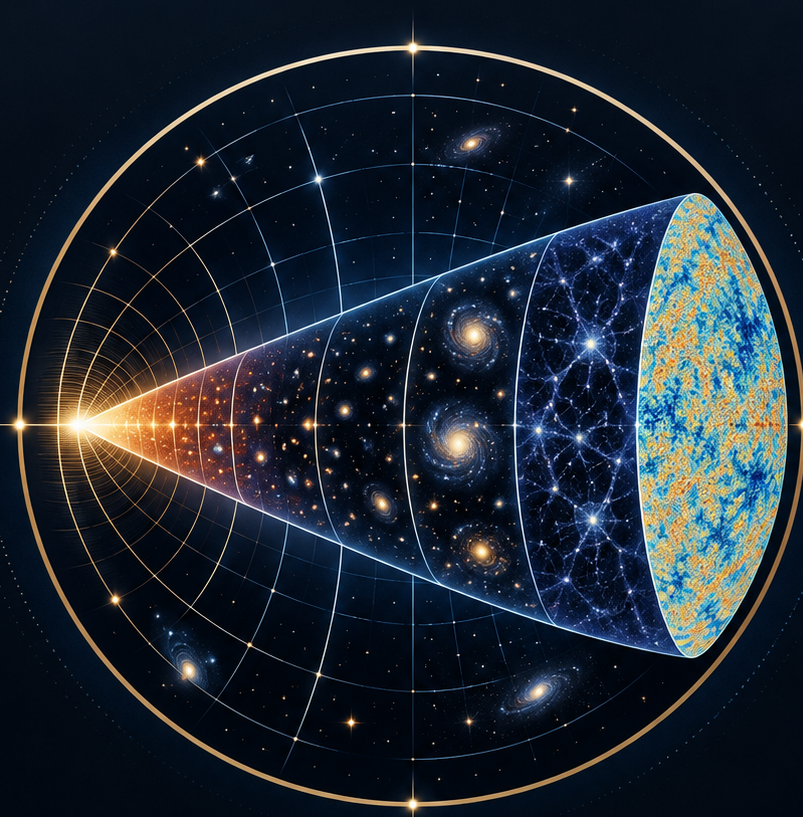
Acoustic peaks are the oscillatory pattern seen in the angular power spectrum of the cosmic microwave background. They arise from standing sound waves in the tightly coupled baryon-photon fluid that filled the universe before recombination. When the universe cooled enough for electrons and protons to combine into neutral hydrogen, the photons decoupled and streamed freely, preserving a snapshot of these waves as temperature anisotropies. The peaks correspond to compression maxima of the waves, while the troughs (dips) are rarefaction minima.
How It Works
The early universe was a hot, dense plasma of photons, electrons, and baryons (mostly protons and helium nuclei). Gravity pulled overdense regions inward, while radiation pressure from photons pushed outward. This competition created oscillating sound waves, similar to how a spring bounces back and forth. The waves propagated at a fraction of the speed of light, carrying information about the primordial density fluctuations seeded by inflation.
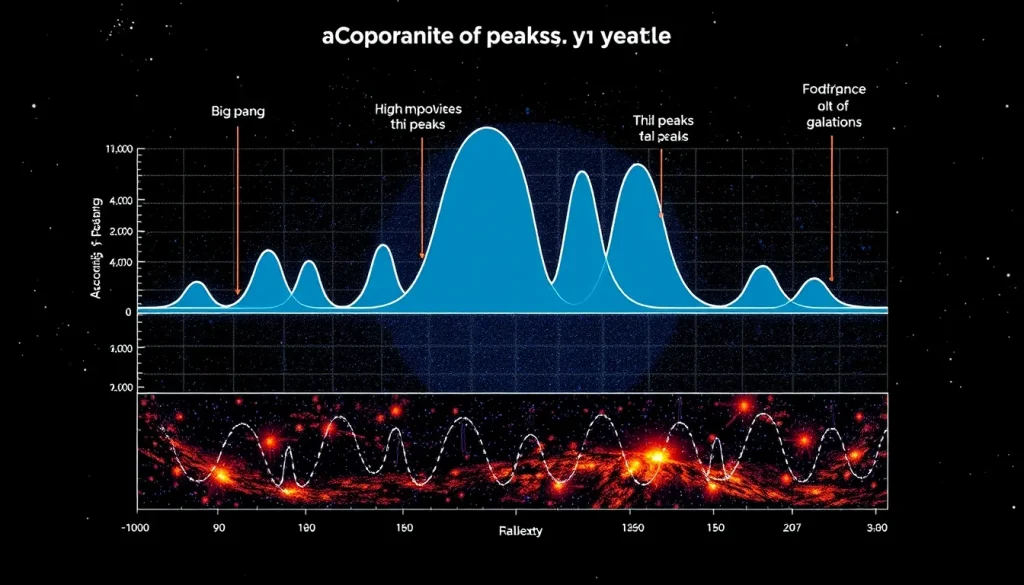
At any given time, a perturbation of a particular wavelength would be caught at a specific phase—compression, rarefaction, or in between. When the universe became transparent (recombination), the photons from compressed regions were slightly hotter (higher energy) and those from rarefied regions slightly cooler. The pattern of these temperature variations on the sky, when decomposed into spherical harmonics, shows a series of peaks at increasing angular multipoles l. The first peak (at about l ≈ 200) indicates the scale of the horizon at recombination, the second peak reveals the baryon density, and the third peak constrains the dark matter density.
Example
Imagine dropping a stone into a pond. The ripples spread outward as circular waves. In the early universe, each overdense region acted like a stone, creating spherical sound waves. At recombination, the waves had traveled a characteristic distance—the sound horizon—which appears as a preferred scale in the CMB. This same scale is later visible in the clustering of galaxies as baryon acoustic oscillations (BAO).
Observable Consequences
- First peak: Determines the total energy density of the universe (spatial curvature).
- Second peak: Measures the baryon density—more baryons compress the fluid more, enhancing odd peaks.
- Third peak: Provides information on dark matter density, which deepens the gravitational potential wells.
- Damping tail: The exponential suppression of peaks at high l reflects the finite thickness of the last scattering surface.
Common Misconceptions
Acoustic peaks are not sound waves traveling through air today, nor are they caused by galaxy clusters. They are primordial fluctuations in the photon-baryon fluid, imprinted at a time when the universe was only a few hundred thousand years old. Also, the peaks do not correspond to individual physical objects; they are statistical features in the angular power spectrum.
The Cosmic Timeline
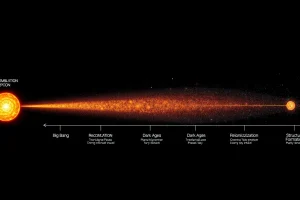
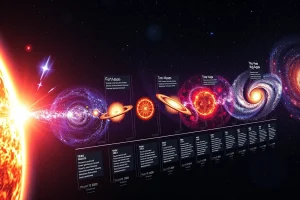
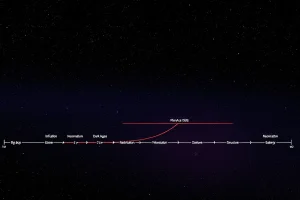
The acoustic peaks are intimately tied to the sequence of cosmic epochs. Below is a table of the major eras, from the Planck epoch to the formation of structure, with approximate temperatures and redshifts.
| Epoch | Time after Big Bang | Temperature | Redshift | Key Events |
|---|---|---|---|---|
| Planck epoch | < 10⁻⁴³ s | > 10³² K | — | Quantum gravity effects dominate; no known physics |
| Grand Unification epoch | 10⁻⁴³ – 10⁻³⁶ s | 10²⁷ – 10³² K | — | Fundamental forces (except gravity) unify |
| Inflationary epoch | 10⁻³⁶ – 10⁻³² s | ~10²⁷ K | — | Exponential expansion; seeds of density fluctuations |
| Electroweak epoch | 10⁻³² – 10⁻¹² s | 10¹⁵ – 10²⁷ K | — | Electromagnetic and weak forces separate |
| Quark epoch | 10⁻¹² – 10⁻⁶ s | 10¹² – 10¹⁵ K | — | Quarks and gluons form quark-gluon plasma |
| Hadron epoch | 10⁻⁶ – 1 s | 10¹⁰ – 10¹² K | — | Protons and neutrons form; baryogenesis |
| Lepton epoch | 1 – 10 s | 10⁹ – 10¹⁰ K | — | Leptons dominate; neutrinos decouple |
| Photon epoch | 10 s – 380,000 yr | 3000 – 10⁹ K | ~3400 – 10⁹ | Photons dominate; BBN; acoustic oscillations |
| Recombination | ~380,000 yr | ~3000 K | ~1100 | Electrons combine with protons; CMB released |
| Dark Ages | 380,000 yr – ~150 million yr | ~60 – 3000 K | ~20 – 1100 | No stars; hydrogen and helium neutral |
| Reionization | ~150 million – 1 billion yr | ~10 – 60 K | ~6 – 20 | First stars and galaxies ionize hydrogen |
| Structure Formation | 1 billion yr – present | 2.7 K | 0 – 6 | Galaxies, clusters, and large-scale structure grow |
Why It Matters
Acoustic peaks are one of the most precise probes of cosmological parameters. They have confirmed the Lambda-CDM model, measured the curvature of space (flat), determined the baryon and dark matter densities, and constrained the Hubble constant. They also provide strong evidence for inflation, as the initial density fluctuations are nearly scale-invariant and Gaussian, matching inflationary predictions. The peaks are the bridge between the microphysics of the early universe and the macroscopic structure we observe today.
Evidence / Sources
The first detection of acoustic peaks came from the BOOMERANG, MAXIMA, and DASI experiments in the early 2000s, which measured the CMB power spectrum on sub-degree scales. The WMAP satellite (2003–2010) provided high-precision measurements of the first few peaks, and the Planck mission (2009–2013) delivered the definitive full-sky map with exquisite precision. These observations are consistent with the predictions of the standard model, as reviewed in the sources below.
Related Registry Entries
FAQ
What exactly are acoustic peaks?
Acoustic peaks are the periodic variations in the temperature of the cosmic microwave background caused by sound waves that traveled through the dense plasma of the early universe. They appear as a series of bumps in the CMB power spectrum.
Why are there multiple peaks?
The peaks correspond to different modes of oscillation. The first peak represents the mode that reached maximum compression at recombination, the second peak is the mode that was maximally rarefied, and so on. Their relative heights encode the baryon and dark matter densities.
How do acoustic peaks support the Big Bang model?
They provide precise measurements of the universe's geometry, composition, and age, all consistent with the Lambda-CDM model. The existence and pattern of peaks are natural predictions of the Big Bang with inflation, and no alternative theory has reproduced them as successfully.

Leave a Reply