Short Answer
Main Explanation
The two-point correlation function, usually written ξ(r), is the workhorse statistic for measuring how galaxies and other tracers of matter are clustered. In its standard definition, it gives the excess probability, above random, of finding two objects separated by a distance r. If the mean number density of galaxies is n, then the probability dP of finding one galaxy in volume dV₁ and another in dV₂ separated by r is dP = n² [1 + ξ(r)] dV₁ dV₂. When ξ(r) is positive, galaxies are more clustered than a Poisson distribution; when negative, they avoid each other; when zero, the distribution is unclustered.
Because the universe is statistically isotropic on large scales, ξ depends only on the scalar separation r, not direction. The two-point correlation function is closely tied to the power spectrum P(k): they form a Fourier transform pair. A Gaussian random field is fully specified by either ξ(r) or P(k). This makes the 2PCF a bridge between the early universe’s quantum fluctuations and today’s cosmic web.
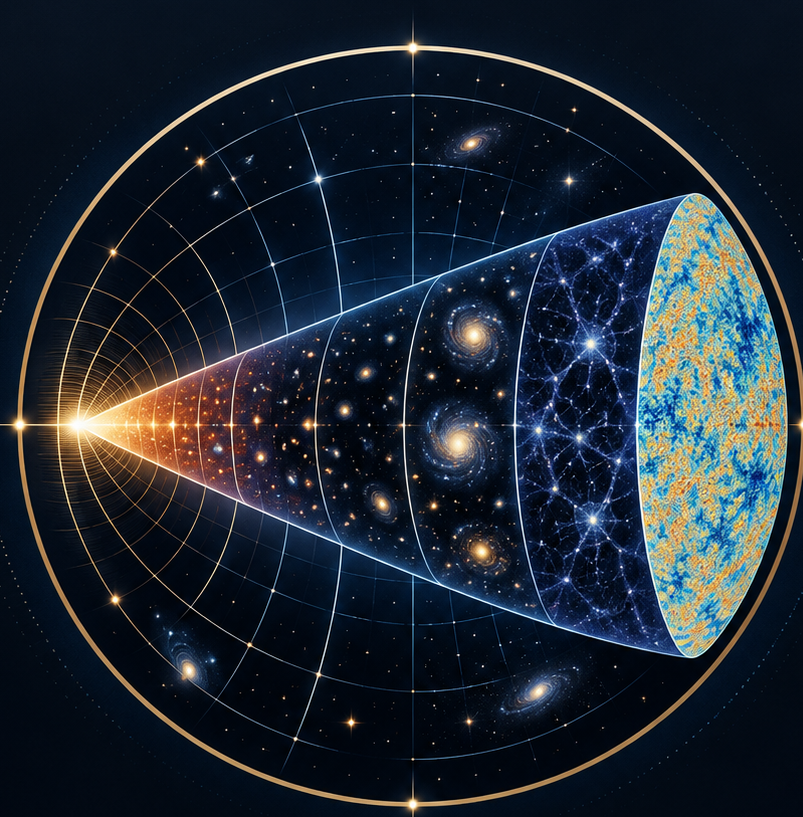
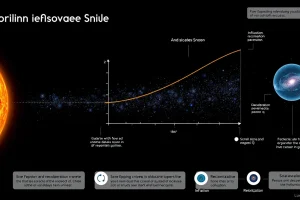
But ξ(r) is not just a static descriptor. Its shape and amplitude encode the entire expansion and structure-formation history. The standard ΛCDM model predicts that tiny primordial density perturbations—stretched by inflation—grew under gravity, leaving a characteristic signature in the galaxy 2PCF: a baryon acoustic oscillation (BAO) peak at about 150 megaparsecs, a smooth power-law decline on small scales, and a turnover on very large scales. Measuring ξ(r) at different redshifts therefore lets cosmologists reconstruct how the universe evolved from the Planck epoch to the present.
| Epoch | Time after Big Bang | Approx. Redshift | Dominant Physics | Relevance to 2PCF |
|---|---|---|---|---|
| Planck epoch | <10⁻⁴³ s | — | Quantum gravity; all forces possibly unified | Sets initial conditions for fluctuations |
| Grand Unification epoch | 10⁻⁴³–10⁻³⁶ s | — | Strong and electroweak forces unified | Possible seeds of baryon asymmetry |
| Inflationary epoch | 10⁻³⁶–10⁻³² s | ~10²⁶ | Rapid exponential expansion; quantum fluctuations stretched | Generates nearly scale-invariant primordial power spectrum |
| Electroweak epoch | 10⁻³²–10⁻¹² s | — | Electromagnetic and weak forces separate | Particle physics sets matter content |
| Quark epoch | 10⁻¹²–10⁻⁶ s | — | Quark-gluon plasma | Baryon number fixed |
| Hadron epoch | 10⁻⁶–1 s | — | Quarks bind into protons and neutrons | Baryonic matter available for later clustering |
| Lepton epoch | 1 s–10 s | — | Leptons and antileptons annihilate | Neutrino background decouples |
| Photon epoch | 10 s–380,000 yr | ~10⁹–1100 | Radiation-dominated; nucleosynthesis | Light elements form; baryon-photon fluid oscillates |
| Recombination | ~380,000 yr | ~1100 | Protons and electrons combine into neutral hydrogen | CMB released; acoustic peaks imprinted in angular 2PCF |
| Dark Ages | 380,000 yr–~150 million yr | 1100–~20 | Neutral hydrogen; no stars | Density perturbations grow in dark matter |
| Reionization | ~150 million–1 billion yr | ~20–6 | First stars and galaxies ionize intergalactic medium | Baryons rejoin structure formation |
| Structure Formation | ~1 billion yr–present | <6 | Gravity assembles galaxies, clusters, cosmic web | Galaxy 2PCF measured directly; BAO peak visible |
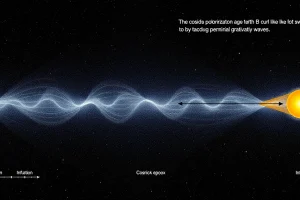
The cosmic microwave background is the most direct relic of the early universe. At recombination, when the universe was about 380,000 years old and at a redshift of roughly 1100, protons and electrons combined into neutral hydrogen, and photons decoupled. The tiny temperature anisotropies in the CMB—about one part in 100,000—are a snapshot of the density perturbations that later grew into galaxies. The angular two-point correlation function of CMB temperature fluctuations shows a series of acoustic peaks, which are the harmonic imprints of sound waves in the baryon-photon fluid before recombination. Missions such as COBE, WMAP, and Planck measured these peaks with increasing precision, confirming the ΛCDM model and pinning down cosmological parameters.
After recombination, the universe entered the Dark Ages, with no luminous sources. The first stars and galaxies formed a few hundred million years later, reionizing the intergalactic medium. The galaxy two-point correlation function today is a direct descendant of those early density perturbations. On scales of about 150 Mpc, the BAO feature—a slight excess of galaxy pairs—acts as a standard ruler, allowing measurements of the expansion history and dark energy. The James Webb Space Telescope is now extending galaxy clustering measurements to high redshifts, probing the era of first light.
Concept: The Two-Point Correlation Function
Definition
ξ(r) is the excess probability, relative to a random Poisson distribution, of finding two tracers separated by distance r. Formally, dP = n² [1 + ξ(r)] dV₁ dV₂, where n is mean number density.
How It Works
Observers count pairs of galaxies in bins of separation, then compare with a random catalog that has the same survey geometry. The Landy & Szalay (1993) estimator is widely used because it minimizes edge effects. The result is a curve of ξ(r) versus r.
Equation
The pair-count estimator can be written as ξ(r) = (DD – 2DR + RR)/RR, where DD, DR, and RR are normalized data-data, data-random, and random-random pair counts. The Fourier relation is ξ(r) = (1/2π²) ∫ P(k) [sin(kr)/(kr)] k² dk.
Example
For the local galaxy distribution, ξ(r) is roughly a power law, ξ(r) ≈ (r/r₀)^(-γ), with r₀ ≈ 5 h⁻¹ Mpc and γ ≈ 1.8 on scales below about 10 h⁻¹ Mpc. At larger scales, the BAO peak appears near 150 Mpc.
Observable Consequences
The 2PCF reveals the cosmic web: galaxies are more clustered on small scales (groups and clusters) and less clustered on very large scales. The BAO peak provides a standard ruler for dark energy. The shape of ξ(r) also constrains dark matter, neutrino mass, and primordial non-Gaussianity.
Common Misconceptions
- Misconception: A positive ξ(r) means galaxies are touching. Reality: It is a statistical excess over random, not a physical contact.
- Misconception: The 2PCF fully describes all clustering. Reality: It captures only two-point information; higher-order correlations are needed for non-Gaussian features.
- Misconception: The CMB angular correlation function is the same as the galaxy 2PCF. Reality: They are related but measured in different spaces (angle vs. comoving distance) and at different epochs.
Why It Matters
The two-point correlation function is a direct bridge from quantum fluctuations to the largest structures. It turns the abstract idea of “clumpiness” into a measurable curve, and that curve contains the history of the universe. By measuring ξ(r) at different redshifts, cosmologists can trace how dark matter and baryons assembled, test inflation, and measure dark energy. It is one of the few tools that connects the Planck epoch to the present-day cosmic web.
Evidence / Sources
The definition and interpretation of ξ(r) follow Peebles (1980) and standard cosmology texts. The Landy & Szalay (1993) estimator is the standard for galaxy surveys. The Fourier relation to the power spectrum is a fundamental result. CMB measurements by COBE, WMAP, and Planck established the acoustic peaks and the ΛCDM parameters. Galaxy surveys such as SDSS and 2dFGRS measured the BAO peak in the 2PCF.
Related Registry Entries
FAQ
What does the two-point correlation function measure?
It measures the excess probability, compared to a random Poisson distribution, of finding two galaxies or other tracers separated by a given distance. Positive values indicate clustering, negative values indicate avoidance, and zero indicates no correlation.
How is ξ(r) related to the power spectrum?
The two-point correlation function and the power spectrum are a Fourier transform pair. A Gaussian random field is fully specified by either one, so they contain the same statistical information in different spaces.
Why is the BAO peak important?
The baryon acoustic oscillation peak at about 150 Mpc is a standard ruler imprinted by sound waves in the early universe. Measuring its position at different redshifts allows cosmologists to trace the expansion history and constrain dark energy.
What is the difference between the CMB angular correlation function and the galaxy 2PCF?
The CMB angular correlation function is measured on the sky as a function of angle and reflects conditions at recombination (z~1100). The galaxy 2PCF is measured in comoving distance and reflects the evolved matter distribution at lower redshifts. They are related through the growth of structure.
How do astronomers estimate ξ(r) from galaxy surveys?
They count pairs of galaxies in bins of separation and compare with a random catalog that has the same survey geometry. The Landy & Szalay (1993) estimator, ξ = (DD - 2DR + RR)/RR, is commonly used to minimize edge effects.
Leave a Reply