Short Answer
Main Explanation
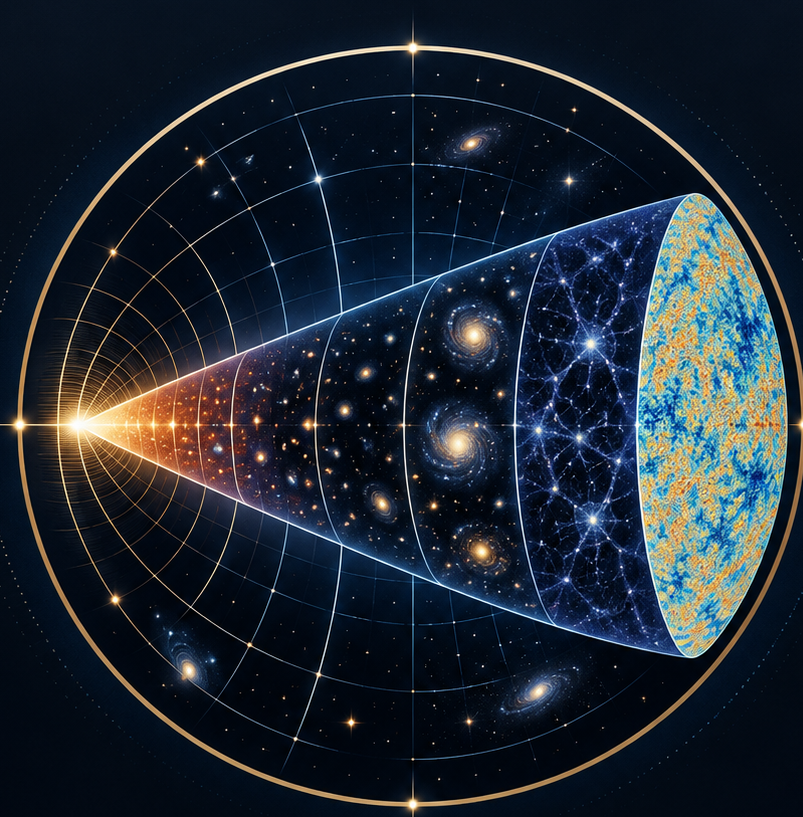
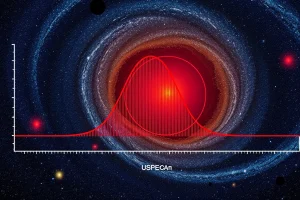
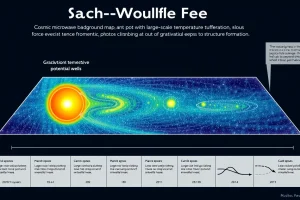
The cosmic microwave background (CMB) is the oldest light in the universe, a nearly uniform glow of radiation left over from the hot, dense state that existed just 380,000 years after the Big Bang. This relic radiation has been stretched by the expansion of space to microwave wavelengths, and it carries a wealth of information about the early universe. The CMB power spectrum is a statistical description of the tiny temperature fluctuations—ripples on the order of 1 part in 100,000—that are observed across the sky. These fluctuations are the seeds from which galaxies and large-scale structures later grew.
By analyzing the power spectrum, cosmologists can infer the geometry of the universe, its composition (baryonic matter, dark matter, dark energy), and the physics of the primordial plasma. The spectrum exhibits a series of acoustic peaks and troughs, corresponding to sound waves that propagated through the photon-baryon fluid before recombination. The positions and heights of these peaks provide precise constraints on cosmological parameters, making the CMB power spectrum one of the most powerful tools in modern cosmology.
Cosmic Epochs: From Planck to Structure Formation
The CMB is a direct window into the state of the universe at recombination, but its detailed properties depend on earlier epochs. The standard Lambda-CDM model describes a sequence of cosmic epochs, each governed by different physical processes. The following table summarizes the major epochs, their approximate times after the Big Bang, redshifts, temperatures, and key events.
| Epoch | Time | Redshift | Temperature | Key Events |
|---|---|---|---|---|
| Planck epoch | < 10⁻⁴³ s | > 10³² | > 10³² K | Quantum gravity effects dominate; no known physics |
| Grand Unification epoch | 10⁻⁴³ – 10⁻³⁶ s | ~10³² – 10²⁸ | 10²⁸ – 10³² K | Strong and electroweak forces unify; inflation begins |
| Inflationary epoch | 10⁻³⁶ – 10⁻³² s | ~10²⁸ – 10²² | Dropping rapidly | Exponential expansion; quantum fluctuations stretched to cosmic scales |
| Electroweak epoch | 10⁻³² – 10⁻¹² s | ~10²² – 10¹⁵ | 10¹⁵ – 10²⁸ K | Electromagnetic and weak forces separate; Higgs mechanism |
| Quark epoch | 10⁻¹² – 10⁻⁶ s | ~10¹⁵ – 10¹² | 10¹² – 10¹⁵ K | Quarks and gluons form quark-gluon plasma |
| Hadron epoch | 10⁻⁶ – 1 s | ~10¹² – 10¹⁰ | 10¹⁰ – 10¹² K | Protons and neutrons form; matter-antimatter asymmetry |
| Lepton epoch | 1 – 10 s | ~10¹⁰ – 10⁹ | 10⁹ – 10¹⁰ K | Leptons and antileptons annihilate; neutrinos decouple |
| Photon epoch | 10 s – 380,000 yr | ~10⁹ – 1100 | ~3000 – 10⁹ K | Photons dominate; primordial nucleosynthesis (BBN) occurs |
| Recombination | ~380,000 yr | ~1100 | ~3000 K | Electrons and protons combine to form neutral hydrogen; CMB released |
| Dark Ages | 380,000 yr – ~150 million yr | 1100 – ~20 | ~3000 – ~60 K | No stars; universe is dark and neutral |
| Reionization | ~150 million – 1 billion yr | ~20 – 6 | ~60 – 20 K | First stars and galaxies ionize hydrogen; reionization of the universe |
| Structure Formation | ~1 billion yr – present | < 6 | < 20 K | Galaxies, clusters, and large-scale structure form under gravity |
The CMB power spectrum directly probes the conditions at recombination, but its shape is shaped by the earlier epochs—especially inflation, which generated the initial density perturbations, and the baryon-photon fluid dynamics that produced the acoustic oscillations.
Measurement of the CMB Power Spectrum
Value
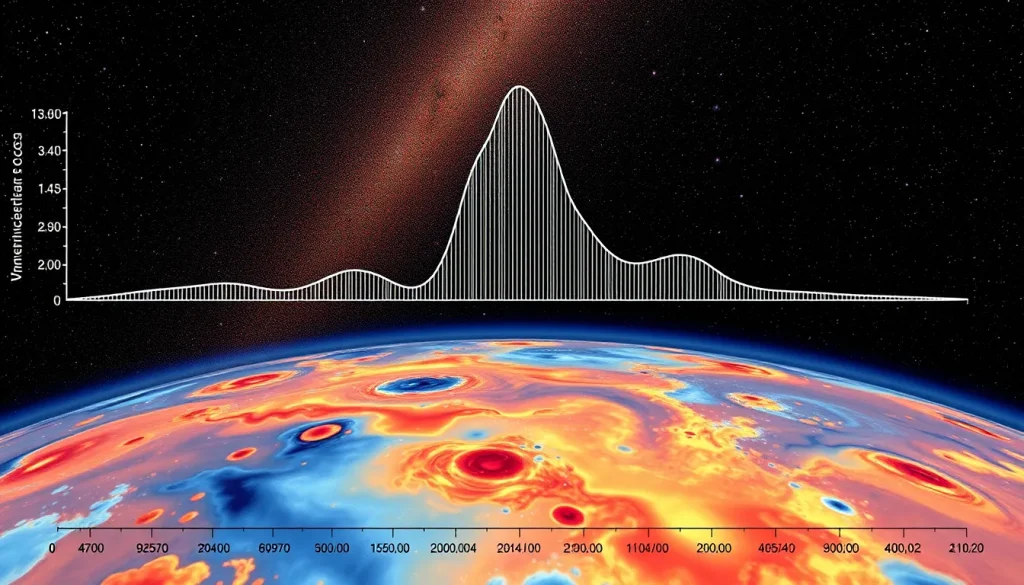
The power spectrum is typically expressed as the angular power spectrum Cℓ, which measures the variance of temperature fluctuations as a function of angular multipole ℓ (roughly 180°/θ). The spectrum shows a series of peaks; the first peak at ℓ ≈ 200 corresponds to an angular scale of about 1°, indicating that the universe is geometrically flat.
Units
The power spectrum is usually plotted as ℓ(ℓ+1)Cℓ/2π in units of (μK)². This normalization makes the spectrum approximately flat in a scale-invariant (Harrison–Zel’dovich) universe.
Instrument
Key space missions include COBE (1989), WMAP (2001), and Planck (2009). These satellites mapped the full sky at microwave frequencies with increasing sensitivity and angular resolution. Ground-based and balloon-borne experiments (e.g., ACT, SPT) have also contributed high-resolution measurements at small angular scales.
Method
The power spectrum is computed from the observed temperature map by decomposing the sky into spherical harmonics. The coefficients aℓm are estimated, and their variance gives Cℓ. This requires careful removal of foreground emission from our galaxy and extragalactic sources, as well as accounting for instrumental noise and beam effects.
Uncertainty
Cosmic variance limits the precision of low-ℓ modes because we only have one observable sky. At high ℓ, instrumental noise and foreground subtraction dominate the error budget. The Planck mission achieved cosmic-variance-limited measurements up to ℓ ≈ 1500, with systematic uncertainties below 1% for key cosmological parameters.
Dataset
The Planck 2018 release (and 2020 final) provides the most precise CMB power spectrum to date, covering ℓ from 2 to 2500. WMAP’s nine-year data and COBE’s FIRAS and DMR results remain foundational. The data are publicly available via the NASA LAMBDA archive.
Latest/Reference Measurement
The Planck 2018 results give a Hubble constant H₀ = 67.4 ± 0.5 km/s/Mpc, a matter density Ωm = 0.315 ± 0.007, and a dark energy density ΩΛ = 0.685 ± 0.007, assuming a flat ΛCDM model. The spectral index of primordial fluctuations ns = 0.965 ± 0.004, consistent with inflation.
Why Measurements Differ
Differences between experiments arise from calibration, foreground modeling, and angular resolution. The ‘Hubble tension’—a discrepancy between CMB-based and distance-ladder measurements of H₀—is an active area of research, possibly indicating new physics or systematic errors.
Why It Matters
The CMB power spectrum is arguably the most important observational tool in cosmology. It confirms the Big Bang model and the existence of dark matter and dark energy. It provides precise measurements of the universe’s age (13.8 billion years), its flat geometry, and the seeds of cosmic structure. The acoustic peaks are a direct consequence of baryon-photon oscillations, and their damping tail constrains the primordial helium abundance and the effective number of neutrino species. The power spectrum also tests inflationary theories by measuring the tilt and possible running of the primordial power spectrum. Without it, we would lack the precise constraints that underpin the current standard model of cosmology.
Evidence / Sources
The interpretation of the CMB power spectrum rests on decades of observations. Key references include the NASA LAMBDA overview of the CMB power spectrum, Klauber’s pedagogical guide to the CMB, the Physics LibreTexts chapter on CMB anisotropies, and Miller’s review of contemporary CMB measurements. These sources detail the theoretical framework, observational techniques, and results that have established the power spectrum as a cornerstone of modern cosmology.
Related Registry Entries
- Cosmic Microwave Background
- Acoustic Peaks
- Recombination
- Inflation
- Large-Scale Structure
- Planck Mission
Last Reviewed: September 5, 2026
FAQ
What does the CMB power spectrum tell us?
It tells us the amplitude of temperature fluctuations at different angular scales, revealing the geometry, composition, and evolution of the universe. The positions and heights of the peaks constrain parameters like the Hubble constant, dark matter density, and curvature.
How is the CMB power spectrum measured?
Satellites like Planck map the full sky at microwave frequencies. The maps are decomposed into spherical harmonics to compute the angular power spectrum, after removing foregrounds and instrumental noise.
Why are there peaks in the power spectrum?
The peaks arise from acoustic oscillations in the photon-baryon plasma before recombination. The first peak corresponds to the fundamental mode, while higher peaks are overtones. Their relative heights depend on the baryon density and other parameters.
Leave a Reply