Short Answer
Main Explanation
The cosmic microwave background (CMB) is the oldest light in the universe, a nearly uniform glow that fills the sky. Imprinted on this radiation are tiny temperature fluctuations—ripples on a pond—that encode the seeds of all cosmic structure. The CMB power spectrum is the mathematical tool that astronomers use to analyze these fluctuations. It plots the variance of temperature differences as a function of angular scale, from the largest patches of sky to the smallest. This spectrum is not just a pretty curve; it is a precise fingerprint of the universe’s initial conditions and its subsequent evolution.
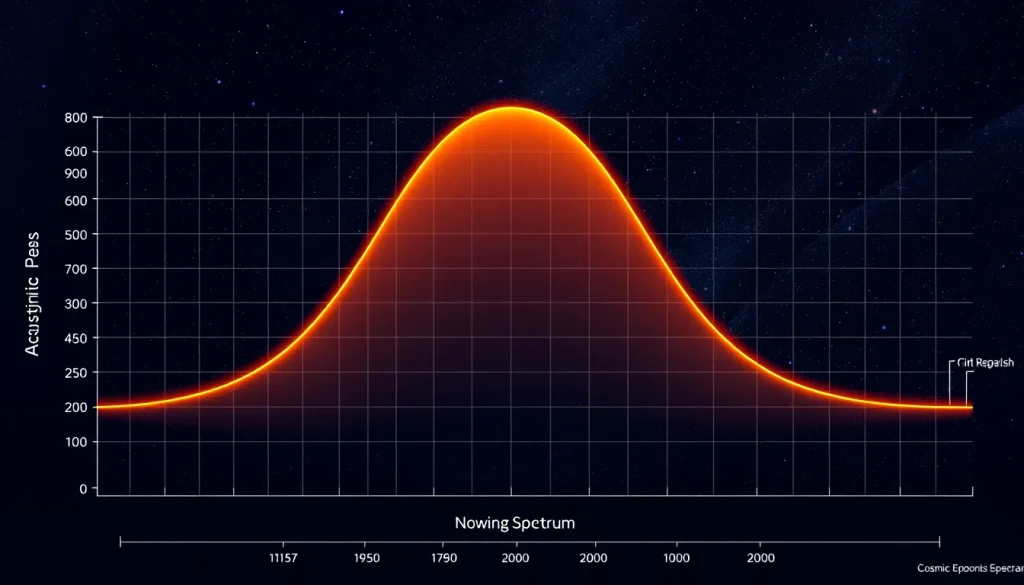
When we measure the CMB temperature across the sky, we find variations of about one part in 100,000. These variations arise from sound waves in the hot plasma of the early universe, gravitational potential shifts at the surface of last scattering, and effects along the photon’s path. The power spectrum quantifies how much each angular scale contributes to these fluctuations. It is a plot of power (the squared amplitude of fluctuations) versus angular multipole moment ℓ (or angular scale). Peaks and troughs in this spectrum correspond to acoustic oscillations in the primordial plasma—compressions and rarefactions that were frozen in when the universe became transparent.
Definition
The CMB power spectrum is a statistical measure that describes the angular distribution of temperature anisotropies in the cosmic microwave background. Mathematically, it is the angular power spectrum Cℓ, defined as the variance of the spherical harmonic coefficients of the temperature map: Cℓ = ⟨|aℓm|²⟩, where aℓm are the coefficients of the spherical harmonic expansion. It tells us how much temperature fluctuation exists on angular scales corresponding to multipole ℓ (roughly 180°/ℓ degrees).
How It Works
To construct the power spectrum, astronomers first create a full-sky map of the CMB temperature, as done by the COBE, WMAP, and Planck satellites. They then decompose the map into spherical harmonics, similar to how a sound wave can be decomposed into pure tones. The power at each multipole ℓ reflects the amplitude of fluctuations on that angular scale. The first peak at ℓ ≈ 200 (angular scale ~1°) indicates the scale of the horizon at last scattering, where sound waves reached their first compression. Subsequent peaks are higher harmonics. The relative heights and positions of these peaks encode the density of baryons, dark matter, and the curvature of space.
Equation
The power spectrum is defined as:
Cℓ = (1/2ℓ+1) Σm |aℓm|², where aℓm are the coefficients of the spherical harmonic decomposition of the temperature fluctuation field ΔT(θ,φ). In practice, cosmologists fit theoretical models to the measured Cℓ curve to extract parameters like the Hubble constant, matter density, and the scalar spectral index of inflation.
Example
The Planck satellite’s 2018 release produced a remarkably precise power spectrum. The first acoustic peak occurs at ℓ ≈ 220, corresponding to an angular scale of about 1°. The second peak is lower than the first, and the third is higher—a pattern that indicates the presence of both baryonic matter (which compresses sound waves) and dark matter (which does not interact with radiation). The overall amplitude of the spectrum, combined with the damping tail at high ℓ, constrains the spectral index of primordial fluctuations to be nearly scale-invariant, as predicted by inflation.
Observable Consequences
The power spectrum reveals several key features of the universe: the total energy density (including dark energy), the baryon density, the dark matter density, the curvature of space, and the initial spectrum of density fluctuations. It also provides evidence for cosmic inflation—the rapid expansion in the first fraction of a second—by showing that fluctuations are nearly scale-invariant and Gaussian. The acoustic peaks are a direct prediction of the Big Bang model and have been confirmed by COBE, WMAP, and Planck.
Common Misconceptions
One common misconception is that the power spectrum is a map of the CMB itself. In reality, it is a statistical summary, not an image. Another is that the peaks represent individual sources; they are actually collective oscillations of the entire plasma. Some also think the CMB is the beginning of the universe, but it is a snapshot of the universe at 380,000 years after the Big Bang, long after the Planck and inflation epochs.
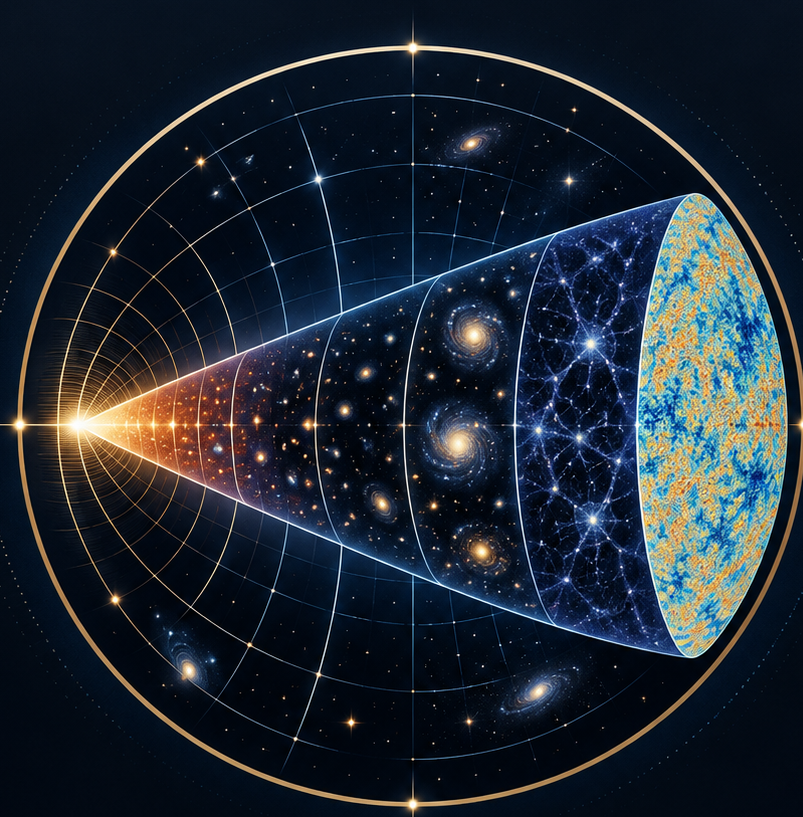
Cosmic Timeline: From Planck Epoch to Structure Formation
The CMB power spectrum connects directly to the sequence of cosmic epochs. Here is a brief timeline of the universe’s evolution, with the CMB serving as a bridge between the hot, dense beginning and the large-scale structure we see today.
| Epoch | Time After Big Bang | Key Events |
|---|---|---|
| Planck Epoch | <10⁻⁴³ s | Quantum gravity effects dominate; no known physics. |
| Grand Unification Epoch | 10⁻⁴³ to 10⁻³⁶ s | Strong and electroweak forces unify; inflation begins. |
| Inflationary Epoch | 10⁻³⁶ to 10⁻³² s | Exponential expansion; quantum fluctuations become seeds of structure. |
| Electroweak Epoch | 10⁻³² to 10⁻¹² s | Electromagnetic and weak forces separate; particles acquire mass. |
| Quark Epoch | 10⁻¹² to 10⁻⁶ s | Quarks and gluons exist in a quark-gluon plasma. |
| Hadron Epoch | 10⁻⁶ to 1 s | Protons and neutrons form; matter-antimatter annihilation. |
| Lepton Epoch | 1 s to 10 s | Leptons dominate; neutrinos decouple. |
| Photon Epoch | 10 s to 380,000 yr | Photons dominate; nucleosynthesis of light elements. |
| Recombination | 380,000 yr | Electrons combine with protons to form neutral hydrogen; CMB released. |
| Dark Ages | 380,000 yr to ~100 million yr | No stars; neutral hydrogen fills the universe. |
| Reionization | ~100 million yr to 1 billion yr | First stars and galaxies ionize hydrogen. |
| Structure Formation | 1 billion yr to present | Galaxies cluster; dark matter shapes cosmic web; dark energy accelerates expansion. |
The CMB power spectrum is most directly tied to the epoch of recombination, when the universe cooled enough for electrons and protons to form neutral hydrogen. The temperature fluctuations we observe are the remnants of acoustic oscillations that were frozen into the plasma at that moment. The precise measurements of the power spectrum by COBE (discovered the fluctuations), WMAP (measured the spectrum to high precision), and Planck (achieved unprecedented accuracy) have confirmed the predictions of the Lambda-CDM model—the standard model of cosmology that includes dark matter, dark energy, and inflation.
Why It Matters
The CMB power spectrum is arguably the most information-rich dataset in cosmology. It allows us to determine the age of the universe (13.77 billion years), its flat geometry, and the relative amounts of ordinary matter (about 5%), dark matter (27%), and dark energy (68%). It also provides strong evidence for inflation, as the observed near-scale-invariant fluctuations match inflationary predictions. Without the power spectrum, we would lack a direct window into the universe’s first moments and the seeds of all cosmic structure.
Evidence / Sources
The data from COBE, WMAP, and Planck missions have been extensively analyzed and published. The LAMBDA (Legacy Archive for Microwave Background Data Analysis) at NASA provides the official power spectrum data and maps. The Planck 2018 results, released in 2020, are the current gold standard. These measurements are consistent with the Lambda-CDM model and rule out many alternative theories. The agreement between the predicted and observed power spectrum is extraordinary, giving us high confidence in our understanding of the universe’s evolution.
Related Registry Entries
For further exploration, see the entries on the Cosmic Microwave Background, Recombination, Acoustic Peaks, Inflation, and the Planck Mission in this encyclopedia.
FAQ
What exactly does the CMB power spectrum measure?
It measures the statistical distribution of temperature fluctuations in the cosmic microwave background as a function of angular scale. It tells us how much variation exists on different-sized patches of the sky, which encodes the physics of the early universe.
How does the power spectrum reveal the composition of the universe?
The relative heights of the acoustic peaks depend on the density of baryons (ordinary matter) and dark matter. Baryons compress sound waves, increasing the odd peaks, while dark matter deepens gravitational wells, affecting all peaks. The overall amplitude and damping tail constrain the spectral index and total density.
Why is the CMB power spectrum considered evidence for inflation?
Inflation predicts that quantum fluctuations were stretched to macroscopic scales, producing a nearly scale-invariant spectrum of density perturbations. The observed power spectrum matches this prediction remarkably well, with a spectral index n_s ≈ 0.965, slightly less than 1, as expected for a slowly rolling inflaton field.
Leave a Reply