Short Answer
Key Facts
- Definition: Redshift (z) = (λ_observed – λ_emitted) / λ_emitted
- Units: Dimensionless
- Primary Method: Spectroscopy of galactic or quasar light
- Typical Instruments: Spectrographs on telescopes like SDSS, Keck, JWST
- Cosmological Significance: Reveals expansion rate, distances, and cosmic epochs
- First Measured: Vesto Slipher (1912) for spiral nebulae; Edwin Hubble (1929) established the distance–redshift relation
Main Explanation
Redshift is one of the most powerful tools in observational cosmology. When we look at a distant galaxy, the light we receive has been stretched by the expansion of the universe. This stretching shifts spectral features toward longer, redder wavelengths—hence the name redshift. The same physics applies to Doppler shifts from motion, but on cosmic scales the dominant effect is the expansion of space itself, known as cosmological redshift.
To measure redshift, astronomers take a spectrum of the object—spreading its light into constituent wavelengths. They then identify known spectral lines, such as the hydrogen Balmer series or the Lyman-α line, and compare the observed wavelengths to laboratory values. The shift gives z, the fractional change. For example, if a galaxy’s hydrogen alpha line (rest wavelength 656.3 nm) is observed at 700 nm, then z = (700−656.3)/656.3 ≈ 0.067. This means the universe has expanded by about 6.7% since the light left the galaxy.
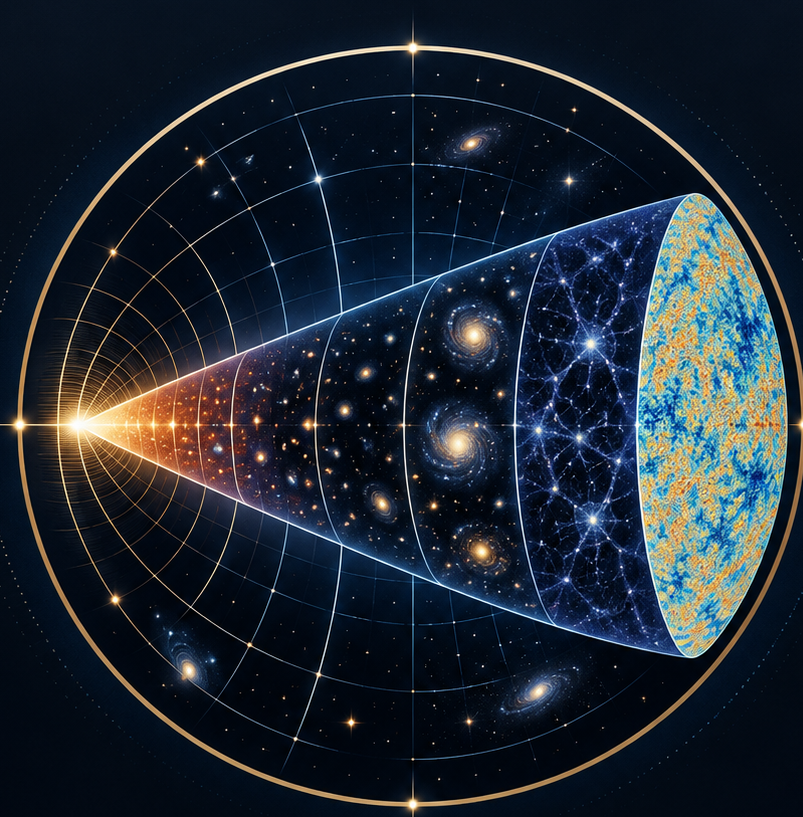
Redshift is not just a measure of recession velocity; it also encodes time. Because light travels at a finite speed, we see distant objects as they were when the light left them. High-redshift objects are seen at earlier cosmic epochs. This allows astronomers to build a timeline of the universe’s evolution, from the hot, dense early phases to the present.
The Cosmic Epochs and Their Redshifts
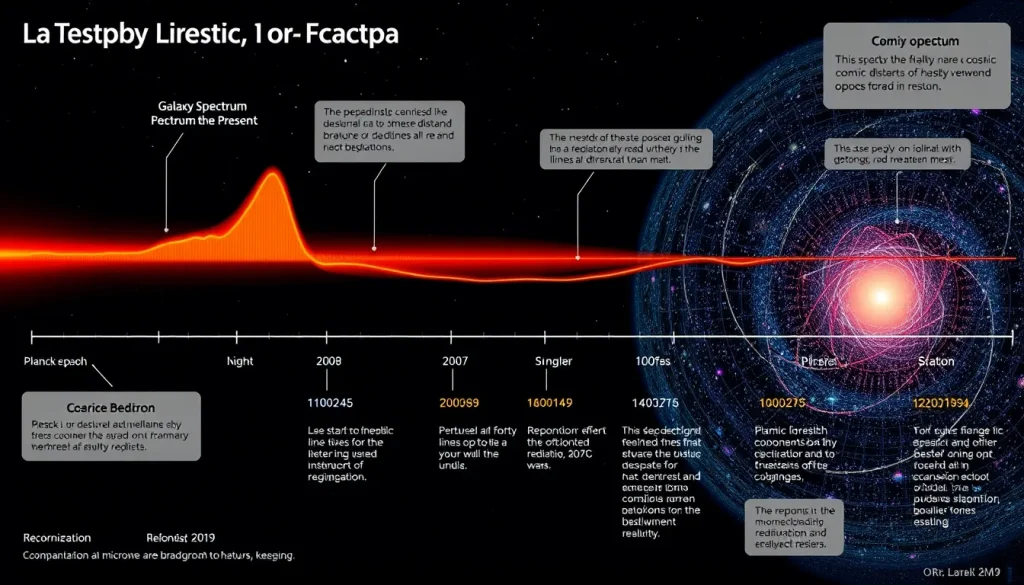
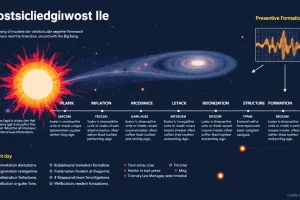
Cosmologists divide the history of the universe into epochs characterized by temperature, energy, and dominant processes. Each epoch corresponds to a range of redshifts, since redshift increases with lookback time. The table below summarizes the major epochs, their approximate redshifts, and key events.
| Epoch | Approx. Redshift (z) | Temperature | Key Events |
|---|---|---|---|
| Planck Epoch | > 10^32 | > 10^32 K | Quantum gravity effects; all forces unified |
| Grand Unification Epoch | 10^32 – 10^27 | 10^27 – 10^32 K | Strong and electroweak forces separate |
| Inflationary Epoch | ~10^27 – 10^25 | Dropping rapidly | Exponential expansion; seeds of structure |
| Electroweak Epoch | 10^15 – 10^12 | 10^15 – 10^16 K | Electromagnetic and weak forces separate |
| Quark Epoch | 10^12 – 10^9 | 10^12 – 10^15 K | Quarks and gluons form a quark–gluon plasma |
| Hadron Epoch | 10^9 – 10^6 | 10^12 – 10^9 K | Protons and neutrons form; matter–antimatter annihilation |
| Lepton Epoch | 10^6 – 10^4 | 10^9 – 10^10 K | Leptons dominate; neutrinos decouple |
| Photon Epoch | 10^4 – 1100 | 10^10 – 3000 K | Photons dominate; nucleosynthesis of light elements |
| Recombination | ~1100 | ~3000 K | Electrons combine with protons to form neutral hydrogen; universe becomes transparent |
| Dark Ages | 1100 – ~20 | 3000 K – ~60 K | No stars yet; only neutral gas and dark matter |
| Reionization | ~20 – 6 | ~60 K – ~20 K | First stars and galaxies ionize hydrogen |
| Structure Formation | 6 – 0 | ~20 K – 2.7 K | Galaxies, clusters, and large-scale structure form |
The cosmic microwave background (CMB) is the relic radiation from recombination. When the universe cooled to about 3000 K, protons and electrons combined to form neutral hydrogen, and photons decoupled from matter. Those photons have been redshifted by a factor of about 1100 and now appear as a nearly uniform glow at 2.725 K—the CMB. Measuring the CMB’s temperature and anisotropies provides a snapshot of the universe at z ≈ 1100, confirming the predictions of the Big Bang model.
Redshift measurements have been crucial in establishing the expansion history. Edwin Hubble’s 1929 observation that galaxies recede at speeds proportional to their distances—now known as the Hubble–Lemaître law—was based on redshift measurements. Modern surveys like SDSS and the Dark Energy Survey map millions of galaxies, measuring redshifts to trace the growth of structure and the influence of dark energy.
Measurement
Value
The redshift parameter z is defined as the fractional change in wavelength: z = (λobs − λem) / λem, where λobs is the observed wavelength and λem is the emitted (rest) wavelength. For cosmological redshifts, z is always positive (light stretched).
Units
Redshift is dimensionless—it is a ratio of wavelengths. Astronomers often quote redshifts as decimal numbers (e.g., z = 0.5) or as velocities in km/s for nearby objects using the non-relativistic approximation v = c·z.
Instrument
Redshift is measured with spectrographs attached to telescopes. Ground-based instruments like the Sloan Digital Sky Survey (SDSS) spectrographs cover optical wavelengths, while space telescopes like the James Webb Space Telescope (JWST) extend into the infrared to catch highly redshifted light. For the CMB, space missions like COBE, WMAP, and Planck measured the spectrum and anisotropies at millimeter wavelengths.
Method
The standard method involves obtaining a spectrum, identifying known emission or absorption lines (e.g., hydrogen Lyman-α, Balmer series, calcium H and K lines), and measuring their observed wavelengths. The ratio of observed to rest wavelength gives 1+z. For galaxies with no strong lines, photometric redshifts are estimated using broadband filters, though less precise.
Uncertainty
Uncertainties arise from spectral resolution, signal-to-noise, and the intrinsic width of spectral lines. Spectroscopic redshifts typically have uncertainties of Δz ≈ 0.001 or better, while photometric redshifts can have errors of a few percent. Peculiar velocities (motions due to gravitational interactions) add a Doppler component that must be accounted for, especially for nearby galaxies.
Dataset
Major datasets include SDSS (over 4 million galaxy spectra), the 2dF Galaxy Redshift Survey, the Dark Energy Survey, and the CMB maps from Planck and WMAP. The NASA/IPAC Extragalactic Database (NED) compiles redshifts from thousands of publications.
Latest/Reference Measurement
The most precise measurement of the CMB redshift is z = 1089.9 ± 0.4, derived from Planck 2018 data. For galaxies, JWST has recently measured redshifts beyond z = 13, probing the epoch of reionization.
Why Measurements Differ
Redshift measurements of the same object can differ due to peculiar velocities, gravitational redshift, and measurement errors. Cosmological redshift is the dominant component for distant objects, but for nearby galaxies (z < 0.01), Doppler motions from galactic rotation and infall can be significant. Additionally, different surveys may use different spectral lines or fitting methods, introducing systematic offsets.
Why It Matters
Redshift is the observational backbone of modern cosmology. It allows us to measure cosmic distances, map the expansion history, and probe the universe’s early epochs. Without redshift, we could not have discovered dark energy (through Type Ia supernova distances vs. redshifts), nor could we have confirmed the predictions of Big Bang nucleosynthesis and the CMB. Redshift surveys reveal the large-scale structure of the universe—filaments, voids, and clusters—providing strong evidence for dark matter and the ΛCDM model. As we push to higher redshifts with JWST and future missions, we directly observe the first galaxies and the epoch of reionization, connecting the earliest moments to our present universe.
Evidence / Sources
The following sources provide authoritative information on redshift measurement and its cosmological significance:
- SDSS SkyServer DR12 – Redshifts tutorial
- ESAC VOSpec Science Tutorial – Calculating the Redshift of Galaxies
- NED Extragalactic Redshifts – Definition and decomposition
- NASA Hubble – Cosmological Redshift
Related Registry Entries
Explore these related topics in our registry:
- Cosmic Microwave Background
- Recombination
- Hubble–Lemaître Law
- Inflation
- Lambda-CDM Model
FAQ
What is the difference between Doppler redshift and cosmological redshift?
Doppler redshift arises from the relative motion of the source and observer in space, while cosmological redshift is caused by the expansion of space itself. For nearby galaxies, Doppler motions dominate; for distant objects, cosmological expansion is the primary effect.
How do astronomers measure redshift for very distant galaxies?
They use spectroscopy to identify spectral lines, often in the infrared because the light has been stretched significantly. For example, JWST observes Lyman-α emission at redshifts beyond 10, shifting the line from ultraviolet to near-infrared wavelengths.
Why is the cosmic microwave background redshifted to microwaves?
The CMB was originally emitted as visible and infrared light at recombination (z≈1100). Over 13.8 billion years, cosmic expansion stretched the wavelengths by a factor of about 1100, turning them into microwaves with a temperature of 2.725 K.


Leave a Reply