Short Answer
Short Answer / Definition
The cosmic microwave background (CMB) anisotropies are tiny temperature fluctuations — roughly one part in 100,000 — in the relic radiation left over from the Big Bang. These fluctuations, first detected by COBE in 1992 and mapped with extraordinary precision by WMAP and Planck, encode the density perturbations that seeded the formation of galaxies and galaxy clusters. By analyzing their angular power spectrum — the statistical distribution of fluctuations across angular scales — cosmologists can determine the universe’s composition: approximately 5% ordinary (baryonic) matter, 27% dark matter, and 68% dark energy, in a spatially flat geometry consistent with the standard ΛCDM model.
Main Explanation
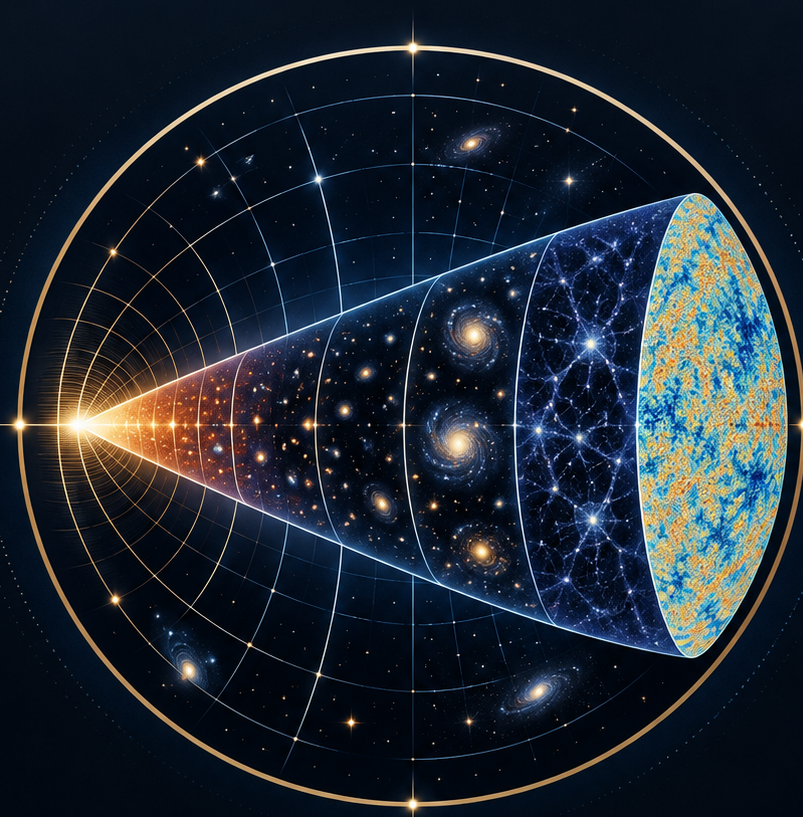
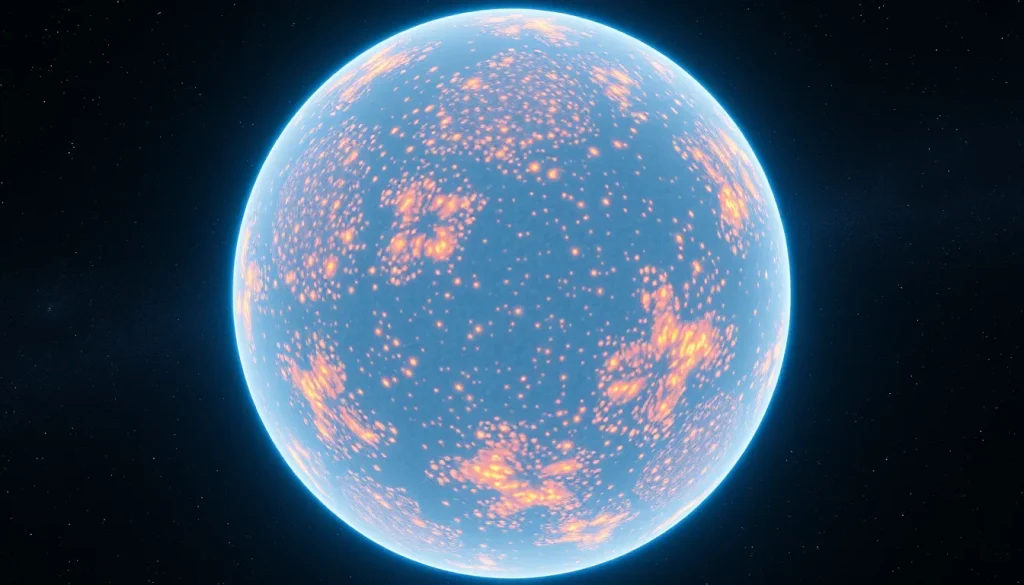
The cosmic microwave background is the oldest light in the universe, released when the cosmos cooled enough for electrons and protons to combine into neutral hydrogen — an event called recombination. This occurred about 370,000 years after the Big Bang, at a redshift of approximately 1100. The CMB we observe today is a snapshot of the universe at that moment, and its tiny temperature variations carry a wealth of information about the composition and evolution of the cosmos.
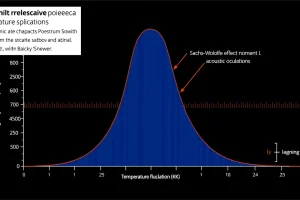
Linear perturbation theory fully accounts for the primary anisotropies. Very low amplitude density and temperature perturbations produce small gravitational effects, leading to an anisotropy that combines temperature fluctuations at the surface of last scattering with gravitational redshifts both at last scattering and along the path to the observer. This clean theoretical foundation — established by Sachs and Wolfe in 1967 — allows extraordinarily precise predictions to be compared with observations, making the CMB the most powerful tool in modern cosmology for constraining fundamental physics and cosmological parameters.
Concept: How CMB Anisotropies Reveal the Universe’s Composition
Definition
Anisotropies are the directional variations in the CMB temperature across the sky. While the CMB is remarkably uniform at 2.725 K, there exist fluctuations of about ±200 microkelvins. These variations arise from two primary sources: (1) density perturbations at the surface of last scattering (the Sachs–Wolfe effect) and (2) the Doppler effect from moving plasma, plus gravitational redshifts along the line of sight. The statistics of these fluctuations — encoded in the angular power spectrum — serve as a Rosetta Stone for deciphering the universe’s composition.
How It Works
The anisotropies form an angular power spectrum with a series of acoustic peaks. The first peak’s position indicates the geometry of the universe: a flat universe places it at multipole ℓ ≈ 200. The relative heights of the odd and even peaks reveal the baryon density, while the overall amplitude and shape constrain the dark matter density and the nature of dark energy. The damping tail at high multipoles constrains the spectral index of primordial fluctuations and the reionization history of the universe.
Think of the CMB anisotropies as a baby photograph of the universe — a snapshot taken when it was just 370,000 years old. Just as a pediatrician can infer a child’s future growth from early measurements, cosmologists use these tiny temperature variations to predict the universe’s entire evolution, from the first atoms to the largest galaxy clusters.
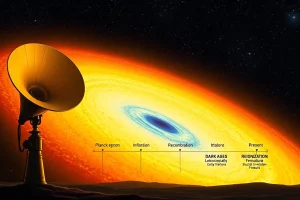
The universe’s evolution is divided into distinct epochs, each governed by different physics. The following timeline summarizes the key stages from the Planck epoch to the present day:
| Epoch | Time | Temperature | Redshift | Key Physics |
|---|---|---|---|---|
| Planck epoch | < 10⁻⁴³ s | > 10³² K | — | Quantum gravity effects dominate |
| Grand Unification | 10⁻⁴³–10⁻³⁶ s | 10²⁸–10³² K | — | Unified fundamental forces |
| Inflation | 10⁻³⁶–10⁻³² s | ~10²⁸ K | — | Exponential expansion; quantum fluctuations stretched to cosmic scales |
| Electroweak | 10⁻³²–10⁻¹² s | 10¹⁵–10²⁸ K | — | Electromagnetic and weak forces separate |
| Quark epoch | 10⁻¹²–10⁻⁶ s | 10¹²–10¹⁵ K | — | Quark–gluon plasma fills the universe |
| Hadron epoch | 10⁻⁶–1 s | 10¹⁰–10¹² K | — | Protons and neutrons form |
| Lepton epoch | 1–10 s | ~10¹⁰ K | — | Leptons dominate; neutrinos decouple |
| Big Bang Nucleosynthesis | 10 s–20 min | 10⁹–10¹⁰ K | ~10⁹ | Light elements (H, He, Li) form |
| Recombination | ~370,000 yr | ~3000 K | ~1100 | Neutral atoms form; CMB released |
| Dark Ages | 370,000 yr–150 Myr | 3000 → 60 K | 1100 → 20 | No luminous sources; hydrogen is neutral |
| Reionization | 150 Myr–1 Gyr | — | 20 → 6 | First stars and galaxies reionize hydrogen |
| Structure Formation | > 1 Gyr | — | < 6 | Galaxies, clusters, and large-scale structure form |
Inflation, driven by a scalar field, stretched quantum fluctuations to cosmic scales, seeding the density perturbations observed in the CMB. These perturbations grew through gravitational instability into the large-scale structure we see today. The first stars, formed during the epoch of reionization, are now being directly observed by the James Webb Space Telescope (JWST), which probes the universe’s first billion years.
Equation
The angular power spectrum is defined as:
Cℓ = (1/(2ℓ+1)) Σm |aℓm|²
where aℓm are the spherical harmonic coefficients of the temperature map, and ℓ is the multipole moment (larger ℓ corresponds to smaller angular scales).
Example
The Planck mission’s 2018 results give Ωbh² ≈ 0.0224 (baryon density), Ωch² ≈ 0.120 (cold dark matter density), and H₀ ≈ 67.4 km/s/Mpc (Hubble constant), consistent with a flat ΛCDM model. The first acoustic peak at ℓ ≈ 200 confirms spatial flatness, while the odd-to-even peak ratio indicates a baryon density of about 5% of the critical density.
Observable Consequences
- First acoustic peak at ℓ ≈ 200 → spatially flat geometry
- Odd-to-even peak height ratio → baryon density
- Damping tail at high multipoles → reionization history and spectral index of primordial fluctuations
- Polarization (E-modes and B-modes) → constraints on inflationary gravitational waves
Common Misconceptions
- The CMB is not “leftover heat” but redshifted light from recombination, stretched by cosmic expansion from ~3000 K to 2.725 K.
- Anisotropies are not random noise; they exhibit a specific, statistically significant angular power spectrum that matches ΛCDM predictions.
- The CMB does not show the universe’s edge; it shows the surface of last scattering — the spherical shell where photons last interacted with matter.
Why It Matters
The CMB anisotropies are the most precise probe of the universe’s composition and evolution. They established the ΛCDM model — a flat, expanding universe dominated by dark energy and dark matter with a small amount of ordinary matter — and continue to constrain fundamental physics, from inflation to neutrino masses. The observation of the CMB anisotropy angular power spectrum with its plateau, acoustic peaks, and high-frequency damping tail has revolutionized our understanding of the universe, transforming cosmology from a speculative field into a precision science.
Evidence / Sources
The theoretical prediction of CMB anisotropies was made by Sachs and Wolfe in 1967, shortly after the CMB’s discovery. COBE first detected the anisotropies in 1992 — a discovery recognized with the Nobel Prize in Physics in 2006. WMAP mapped them with unprecedented precision from 2001 to 2010, and Planck extracted nearly all the cosmological information in the temperature anisotropies from 2009 to 2013, with deep forays into polarization. Together, these missions established the standard cosmological model and determined the universe’s composition to remarkable precision.
Related Registry Entries
FAQ
What are CMB anisotropies?
CMB anisotropies are tiny temperature fluctuations in the cosmic microwave background radiation — about one part in 100,000 — that reveal the density perturbations present in the early universe at the surface of last scattering, about 370,000 years after the Big Bang.
How do anisotropies reveal the universe's composition?
By analyzing the angular power spectrum — the positions and relative heights of acoustic peaks — cosmologists can extract the baryon density, dark matter density, dark energy density, and the spatial geometry of the universe. The Planck 2018 results give Ω_b h² ≈ 0.0224 and Ω_c h² ≈ 0.120, consistent with a flat ΛCDM model where dark energy constitutes about 68% of the universe's energy density.
What is the first acoustic peak?
The first acoustic peak, located at multipole ℓ ≈ 200, corresponds to the angular scale of the sound horizon at last scattering. Its position confirms that the universe is spatially flat, and its height relative to subsequent peaks encodes the baryon density.
What missions measured the CMB anisotropies?
COBE first detected the anisotropies in 1992. WMAP mapped them with unprecedented precision from 2001 to 2010. The Planck satellite (2009–2013) extracted nearly all the cosmological information in the temperature anisotropies and made deep forays into polarization, setting new standards of accuracy.
Leave a Reply