Short Answer
Main Explanation
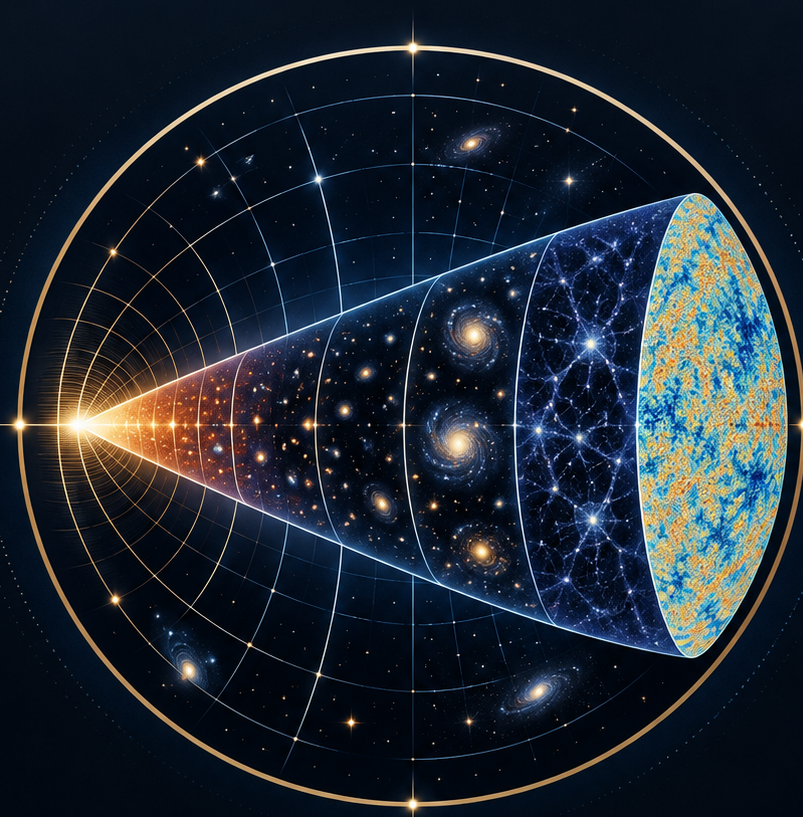
The cosmic microwave background (CMB) is the oldest light in the universe, released about 380,000 years after the Big Bang when the cosmos had cooled enough for protons and electrons to combine into neutral hydrogen. Today that light arrives from every direction as a nearly uniform glow at 2.725 K. Yet it is not perfectly smooth: superimposed on the average temperature are tiny hot and cold spots—regions where the CMB is a few tens of microkelvin warmer or cooler than average. These spots are the fossil imprints of density fluctuations in the early universe, and they are among the most important observations in modern cosmology.
The fluctuations are extraordinarily small. The COBE satellite’s Differential Microwave Radiometer (DMR) first mapped them in 1992, showing that typical deviations are only about one part in 100,000 relative to the mean temperature. In visual maps, red pixels mark slightly hotter regions and blue pixels mark slightly cooler ones. Although they look like random noise, their statistical properties encode the physics of inflation, the nature of dark matter, and the geometry of the universe.
A Timeline of the Early Universe
To understand where hot and cold spots come from, it helps to trace the major epochs from the Planck era to the present. The table below summarizes the standard ΛCDM timeline.
| Epoch | Time after Big Bang | Temperature | Key events |
|---|---|---|---|
| Planck epoch | < 10⁻⁴³ s | > 10³² K | Quantum gravity dominates; known physics breaks down. |
| Grand Unification epoch | 10⁻⁴³ – 10⁻³⁶ s | ~10²⁹ K | Strong and electroweak forces possibly unified; inflation may begin. |
| Inflationary epoch | 10⁻³⁶ – 10⁻³² s | ~10²⁷ K | Exponential expansion stretches quantum fluctuations to cosmic scales. |
| Electroweak epoch | 10⁻³² – 10⁻¹² s | ~10¹⁵ K | Electromagnetic and weak forces separate; W, Z, Higgs particles appear. |
| Quark epoch | 10⁻¹² – 10⁻⁶ s | ~10¹² K | Quarks, leptons, and gluons form a hot plasma. |
| Hadron epoch | 10⁻⁶ – 1 s | ~10¹⁰ K | Quarks bind into protons and neutrons. |
| Lepton epoch | 1 – 10 s | ~10⁹ K | Leptons and antileptons annihilate; neutrinos decouple. |
| Photon epoch | 10 s – 380,000 yr | 10⁹ – 3000 K | Nucleosynthesis creates light elements; universe remains ionized. |
| Recombination | ~380,000 yr | ~3000 K | Protons and electrons form neutral hydrogen; CMB released. |
| Dark Ages | 380,000 – ~150 million yr | 3000 – 60 K | No stars; neutral hydrogen fills the universe. |
| Reionization | ~150 million – 1 billion yr | ~60 – 20 K | First stars and galaxies ionize intergalactic gas. |
| Structure formation | ~1 billion yr – present | 20 – 2.725 K | Galaxies, clusters, and large-scale structure grow from initial fluctuations. |
Concept: Hot and Cold Spots as Cosmic Thermometers
Definition
A hot spot in the CMB is a small patch of sky where the measured temperature is slightly above the all-sky average of 2.725 K; a cold spot is a patch where it is slightly below. The temperature difference is usually expressed as a fractional deviation, ΔT/T, where ΔT is the local temperature minus the mean and T is the mean. For typical spots, ΔT/T is on the order of 10⁻⁵, meaning the absolute temperature changes by only about 30–100 microkelvin.
How It Works
The spots are not objects in space; they are angular patterns in the CMB radiation field. They arise because the early universe was not perfectly uniform. Quantum fluctuations during inflation created tiny over-densities and under-densities. Over-dense regions had slightly stronger gravitational potential, so photons climbing out of them lost a bit more energy and appeared cooler; under-dense regions produced slightly hotter photons. This is the Sachs-Wolfe effect on large angular scales. At recombination, these temperature differences were frozen into the CMB when photons decoupled from matter. The pattern we see is a snapshot of those primordial density fluctuations, projected onto the sky.
Equation
The fundamental observable is the temperature contrast:
ΔT/T ≈ 1 × 10⁻⁵
On large angular scales, the Sachs-Wolfe effect relates this to the Newtonian gravitational potential Φ:
ΔT/T = -Φ/3
This equation links the observed hot and cold spots to the primordial potential wells and hills that later seeded galaxies and clusters.
Example
The most famous cold spot is the WMAP Cold Spot, located in the constellation Eridanus. It is a region roughly several degrees across that is tens of microkelvin colder than the surrounding CMB. While it is statistically unusual, it is not necessarily a contradiction of the standard model; it could be a large under-density (a supervoid) or simply a rare fluctuation. Analyses of WMAP five-year data by Hou et al. (2009) examined the one-point statistics of such local extrema—number, mean, variance, skewness, and kurtosis—to test whether the spots follow Gaussian expectations.
Observable Consequences
The distribution of hot and cold spots is a powerful probe of cosmology. If the primordial fluctuations are exactly Gaussian, the number of spots above a given temperature threshold follows a predictable statistical distribution. Deviations from this—such as an excess of very cold spots or a skewness in their temperature distribution—would indicate non-Gaussianity, which could point to new physics beyond single-field slow-roll inflation. Chingangbam et al. (2012) showed that simply counting hot and cold spots in excursion sets can discriminate between different non-Gaussian models. The angular power spectrum of the CMB, which quantifies how much fluctuation power exists on different angular scales, also depends on the statistical properties of these spots.
Common Misconceptions
- Misconception: Hot and cold spots are actual physical objects like stars or galaxies.
Reality: They are temperature variations in the radiation field, not discrete objects. They trace density fluctuations but are not the galaxies themselves. - Misconception: The CMB cold spot proves the existence of a parallel universe or a collision with another universe.
Reality: While such ideas have been proposed, they are speculative. The cold spot is consistent with a statistical fluctuation or a large void within standard ΛCDM. - Misconception: The spots are caused by the Milky Way or local sources.
Reality: Foreground emission from the galaxy is carefully subtracted. The spots are cosmological, as confirmed by their statistical isotropy and agreement with predictions.
Why It Matters
Hot and cold spots are the bridge between the universe’s first moments and its present structure. The over-dense regions that appear as cold spots on large scales later collapsed under gravity to form galaxy clusters, while under-dense regions became voids. By measuring the statistical properties of these spots, cosmologists can test inflation, constrain the amount of dark matter and dark energy, and determine the geometry of the universe. The nearly scale-invariant spectrum of fluctuations—first hinted at by COBE and refined by WMAP and Planck—is a triumph of the inflationary paradigm. Any deviation from Gaussianity would be a major discovery, potentially revealing new physics at energy scales far beyond the reach of particle accelerators.
Evidence / Sources
The observational foundation for hot and cold spots comes from a series of space missions. COBE’s DMR instrument provided the first full-sky map of CMB anisotropies in 1992, showing the red and blue mottling at a resolution of about 7 degrees. WMAP then mapped the CMB with much higher angular resolution and sensitivity, and its five-year data were used by Hou et al. (2009) to perform a frequentist analysis of the one-point statistics of local extrema. The Planck satellite further improved the measurements, mapping the CMB at angular scales down to a few arcminutes. Ground-based and balloon-borne experiments continue to refine the picture. The use of hot and cold spot counts as probes of non-Gaussianity was formalized by Chingangbam et al. (2012), demonstrating that simple counts can distinguish between Gaussian and non-Gaussian models.
Related Registry Entries
FAQ
What exactly are hot and cold spots in the CMB?
They are small regions on the sky where the cosmic microwave background temperature is slightly higher (hot) or lower (cold) than the average 2.725 K. Typical deviations are about 30–100 microkelvin, or roughly one part in 100,000.
What causes these temperature differences?
They originate from tiny quantum fluctuations in the density of the early universe, stretched to cosmic scales by inflation. At recombination, photons escaping from denser regions were slightly hotter, while those from under-dense regions were cooler.
Is the famous CMB Cold Spot a sign of new physics?
The Cold Spot in Eridanus is statistically unusual but not necessarily a contradiction of standard cosmology. It could be a large under-density (a supervoid) or a rare statistical fluctuation; no consensus exists that it requires exotic explanations.
How do hot and cold spots help test inflation?
Inflation predicts a nearly scale-invariant spectrum of Gaussian fluctuations. The statistical distribution of hot and cold spots—their counts, clustering, and temperature distribution—can reveal deviations from Gaussianity, which would challenge the simplest inflation models.
Leave a Reply