Short Answer
Main Explanation
The baryon-to-photon ratio, denoted by the Greek letter η (eta), is the number of baryons (protons and neutrons) compared to the number of photons in the universe. It is a fundamental parameter of the standard cosmological model (ΛCDM) because it sets the stage for the synthesis of light elements in the first minutes after the Big Bang and influences the patterns we see in the cosmic microwave background (CMB).
Definition
Formally, η = nb / nγ, where nb is the number density of baryons and nγ is the number density of photons. In a universe that is homogeneous and isotropic on large scales, this ratio is essentially constant over cosmic time (photons and baryons both dilute with expansion, though at slightly different rates). The measured value today is approximately 6 × 10⁻¹⁰, meaning there is roughly one baryon for every 10 billion photons [4].
How It Works
The ratio emerges from the early universe’s particle physics. In the first seconds, particle-antiparticle pairs were created and annihilated in thermal equilibrium. A tiny asymmetry—about one extra baryon per billion pairs—survived, leading to the matter-dominated universe we see. The photons from annihilations and from later electron-positron annihilation remain as the CMB, providing a vast sea of radiation. The baryon-to-photon ratio quantifies this asymmetry.
Equation
The present-day number density of photons from a blackbody at temperature T is given by nγ ≈ 0.244 (kT/ħc)3 [4]. With TCMB = 2.73 K, this yields about 413 photons per cubic centimeter. The baryon density can be expressed in terms of the cosmic baryon density parameter Ωbh2. The relation is:
η ≡ nb/nγ = 6.0 × 10⁻¹⁰ (Ωbh2 / 0.0222) [4]
Alternatively, using the measured baryon mass density ρm ≈ 4.2 × 10⁻³¹ g cm−3 (about 5% of the critical density) and the photon density of ~3.7 × 102 cm−3, one obtains η ≈ 5 × 10⁻¹⁰ [2].
Example
Imagine a large bucket filled with 10 billion tiny grains of sand (photons) and just one small pebble (a baryon). That’s the cosmic proportion. The pebble carries almost all the mass, but the sand dominates the number count. This extreme imbalance is why the early universe was radiation-dominated yet still managed to form matter structures later.
Observable Consequences
The baryon-to-photon ratio directly controls the outcome of Big Bang nucleosynthesis (BBN). A higher η means more baryons per photon, leading to more efficient helium-4 production and less deuterium left over. The observed primordial abundances of deuterium, helium-3, helium-4, and lithium-7 are exquisitely sensitive to η. Additionally, η affects the damping tail and acoustic peak heights in the CMB power spectrum, providing an independent measurement. Modern values from Planck satellite CMB data and BBN analyses agree remarkably well, confirming the ΛCDM model [1][3].
Common Misconceptions
One misconception is that η is a constant of nature. In reality, it is an initial condition of the universe—a parameter that must be explained by baryogenesis theories, not derived from first principles. Another mistake is thinking that baryons include dark matter; they do not. Dark matter is non-baryonic and does not contribute to η. Finally, some assume η can be measured directly by counting particles, but it is inferred from cosmological observations like the CMB and light-element abundances.
Cosmic Epochs and the Role of η
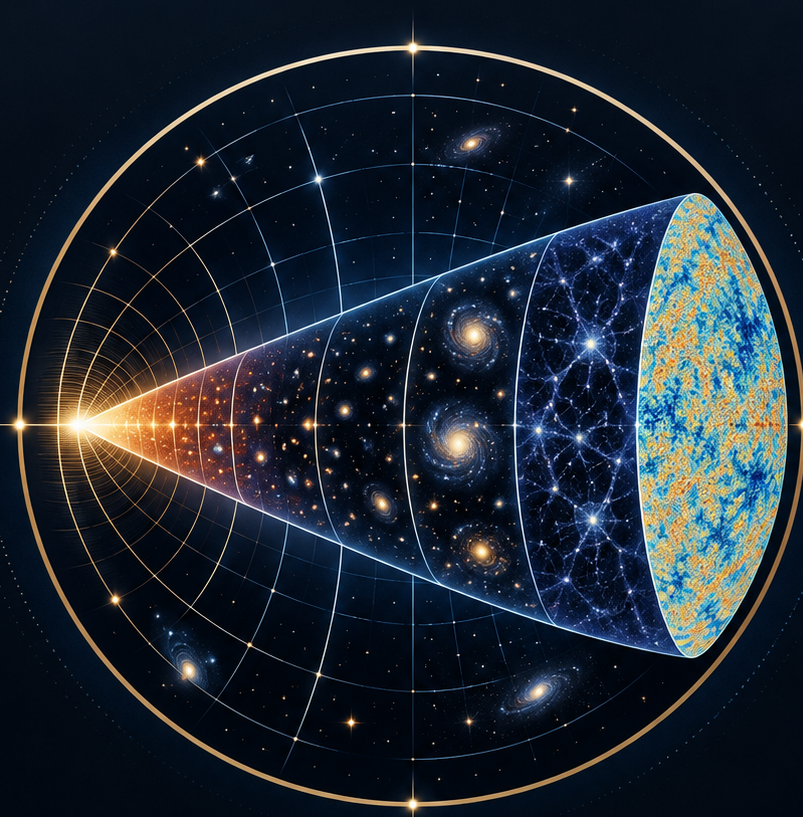
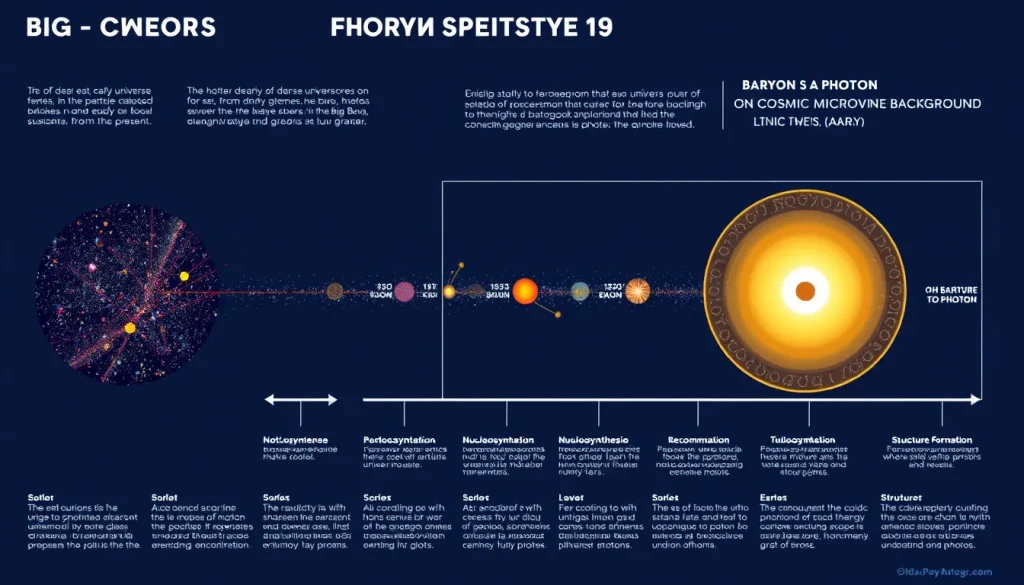
The baryon-to-photon ratio remains nearly constant after the first second, but its influence is felt throughout cosmic history. The table below summarizes the major epochs and how η shapes them.
| Epoch | Time | Temperature | Key Events |
|---|---|---|---|
| Planck epoch | < 10−43 s | > 1032 K | Quantum gravity era; unknown physics |
| Grand Unification epoch | 10−43 – 10−36 s | 1028 – 1032 K | Unified forces separate; baryogenesis possible |
| Inflationary epoch | 10−36 – 10−32 s | Dropping rapidly | Exponential expansion; seeds for structure |
| Electroweak epoch | 10−32 – 10−12 s | 1015 – 1028 K | Electromagnetic and weak forces separate; W, Z bosons gain mass |
| Quark epoch | 10−12 – 10−6 s | 1012 – 1015 K | Quarks and gluons form plasma |
| Hadron epoch | 10−6 – 1 s | 1010 – 1012 K | Protons and neutrons form; baryon asymmetry fixed |
| Lepton epoch | 1 – 10 s | 109 – 1010 K | Leptons dominate; neutrinos decouple |
| Photon epoch | 10 s – 380,000 yr | 104 – 109 K | BBN produces light elements; photons dominate |
| Recombination | ~380,000 yr | ~3000 K | Electrons combine with nuclei; CMB released |
| Dark Ages | 380,000 – ~150 million yr | ~100 – 3000 K | No stars; neutral hydrogen fills space |
| Reionization | ~150 million – 1 billion yr | ~10 – 100 K | First stars and galaxies ionize hydrogen |
| Structure Formation | 1 billion yr – present | 2.73 K | Galaxies, clusters, and large-scale structure form |
The value of η determines the exact timing and efficiency of BBN during the photon epoch, and it influences the sound horizon that imprints acoustic peaks on the CMB. Without the precise measurement of η, we could not predict the observed helium abundance or the peak heights in the CMB power spectrum.
Why It Matters
The baryon-to-photon ratio is not just a number—it is a fingerprint of the universe’s early particle physics. It tells us how much ordinary matter exists relative to radiation, which governs the transition from radiation-dominated to matter-dominated expansion. This transition sets the scale for structure formation. Moreover, η provides a target for theories of baryogenesis, the process that created the matter-antimatter asymmetry. Any successful model must explain why η is so small (about 10−9) and yet non-zero. The ratio also anchors the calibration of cosmological parameters: from η we derive the baryon density Ωbh2, which is essential for interpreting CMB data and testing extensions to the standard model [3].
Evidence / Sources
The baryon-to-photon ratio is measured through two independent routes that agree within uncertainties:
- Big Bang Nucleosynthesis: Primordial abundances of deuterium and helium-4, observed in quasar absorption systems and metal-poor galaxies, constrain η to high precision [1].
- Cosmic Microwave Background: The relative heights of the acoustic peaks in the CMB power spectrum, measured by COBE, WMAP, and Planck, provide a geometric determination of Ωbh2 [3].
For example, the Planck satellite’s final data release gives Ωbh2 = 0.0224 ± 0.0001, corresponding to η ≈ 6.1 × 10⁻¹⁰, consistent with BBN predictions. The agreement between these two vastly different epochs is a powerful confirmation of the ΛCDM model.
Related Registry Entries
Last Reviewed / Updated: September 5, 2026
FAQ
Why is the baryon-to-photon ratio so small?
The small value (~10⁻⁹) reflects the cosmic matter-antimatter asymmetry. During the first fractions of a second, particle-antiparticle pairs annihilated, leaving a tiny excess of baryons—about one in a billion—that survived to form all visible matter. The exact mechanism that produced this asymmetry is still an open question in physics, known as baryogenesis.
How is the baryon-to-photon ratio measured?
Two independent methods are used: (1) Big Bang nucleosynthesis predictions for primordial deuterium and helium abundances, compared with observations of distant gas clouds; and (2) the relative heights of acoustic peaks in the cosmic microwave background power spectrum, as measured by satellites like COBE, WMAP, and Planck. Both give consistent values, confirming the ΛCDM model.
Does the baryon-to-photon ratio change over time?
After the first second, η remains nearly constant because both baryons and photons dilute with cosmic expansion at the same rate. However, at very early times (before electron-positron annihilation) the photon number density was different, so η evolved slightly. Today, it is a fixed parameter of the universe.



Leave a Reply