Short Answer
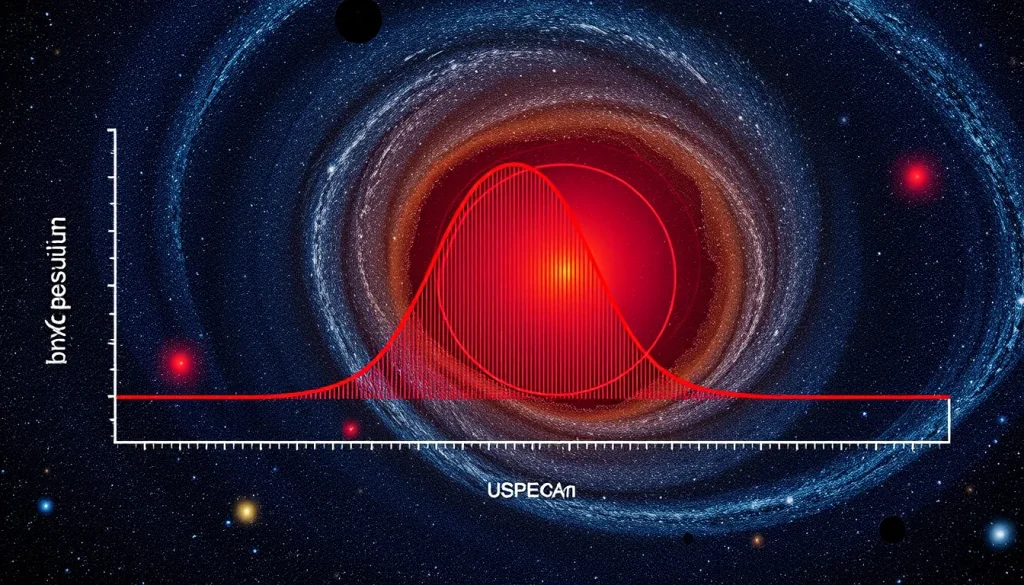
Short Answer: Acoustic peaks are periodic oscillations in the cosmic microwave background (CMB) temperature power spectrum. They arise from sound waves that propagated through the dense photon-baryon plasma of the early universe before recombination. Their positions and amplitudes encode fundamental cosmological parameters, including the spatial curvature, baryon density, and dark matter density.
| Attribute | Detail |
|---|---|
| Phenomenon | Oscillations in CMB temperature anisotropy power spectrum |
| Cause | Sound waves in the photon-baryon fluid before recombination |
| First detected | BOOMERANG, MAXIMA, DASI (early 2000s) |
| Key missions | COBE, WMAP, Planck |
| Significance | Constrain cosmological parameters, support ΛCDM model |
| Angular scale | First peak at l ≈ 200 (about 1 degree) |
Main Explanation
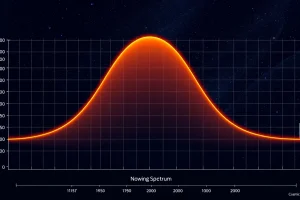
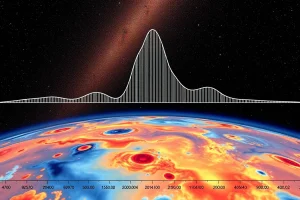
The cosmic microwave background is the oldest light we can observe, a relic of the universe when it was just 380,000 years old. At that time, the universe had cooled enough for electrons and protons to combine into neutral hydrogen, allowing photons to travel freely. These photons carry a snapshot of the density fluctuations that would later grow into galaxies and clusters. But the CMB is not perfectly uniform; it has tiny temperature variations on the order of one part in 100,000. These variations, when decomposed into spherical harmonics, produce a power spectrum with a series of peaks and dips—the acoustic peaks.
The physics behind these peaks is elegant. In the early universe, the plasma of photons, electrons, and baryons was tightly coupled. Gravity pulled matter into overdense regions, while radiation pressure from photons pushed it back out, creating oscillating sound waves—acoustic oscillations. These waves traveled at a fraction of the speed of light, with a characteristic speed determined by the sound speed in the plasma. When recombination occurred, the waves were frozen into the distribution of matter and radiation, leaving an imprint on the CMB.
Each acoustic peak corresponds to a particular mode of oscillation. The first peak represents the mode that had exactly one half-wavelength compressed within the sound horizon at recombination—the maximum distance a sound wave could travel since the Big Bang. The second peak is the full-wavelength mode, and so on. The positions of these peaks are exquisitely sensitive to the geometry of the universe: if space is flat, the peaks appear at the angles predicted by the standard model; if curved, they shift. The relative heights of the peaks depend on the density of baryons and dark matter, because baryons increase the compression (odd peaks) while dark matter enhances the rarefaction (even peaks).
The first measurements of acoustic peaks came from the balloon-borne BOOMERANG and MAXIMA experiments and the DASI interferometer in the early 2000s. They confirmed the first peak at l ≈ 200, indicating a flat universe. Later, the WMAP satellite and the Planck mission mapped the CMB with extraordinary precision, measuring the first five acoustic peaks and many more, solidifying the ΛCDM model.
Cosmic Timeline and the Role of Acoustic Peaks
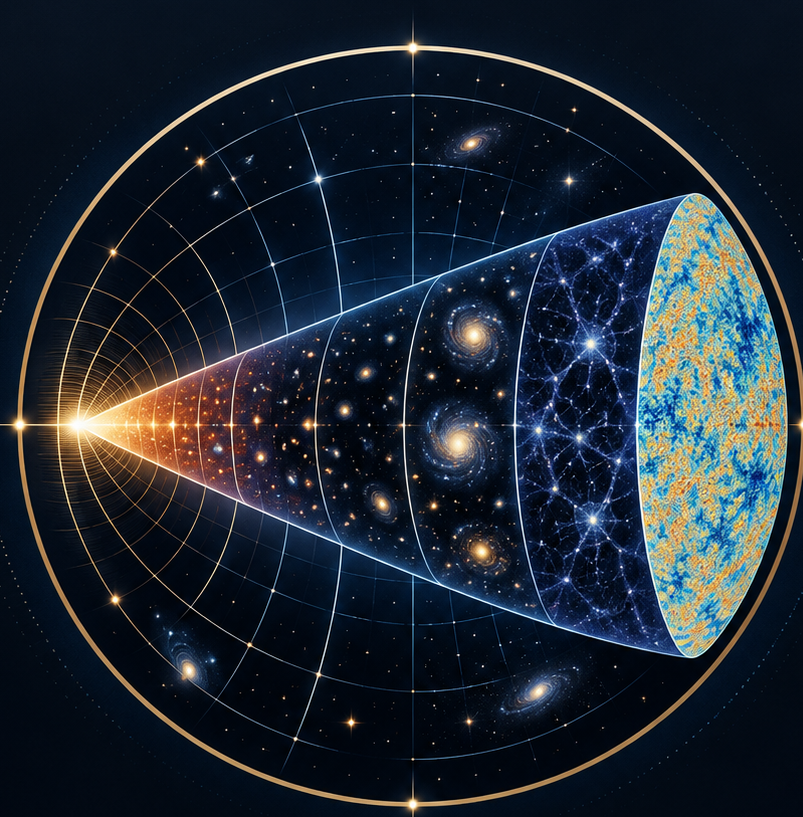
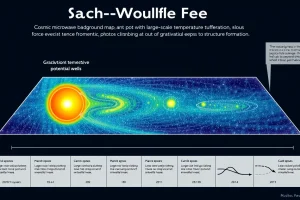
To understand acoustic peaks, it helps to place them in the broader cosmic timeline. The universe began with the Planck epoch, followed by inflation, reheating, and the standard Big Bang phases. The table below summarizes the major epochs and their key features.
| Epoch | Time After Big Bang | Temperature | Key Events |
|---|---|---|---|
| Planck epoch | < 10⁻⁴³ s | > 10³² K | Quantum gravity effects dominate |
| Grand Unification epoch | 10⁻⁴³ – 10⁻³⁶ s | 10²⁸ – 10³² K | Unified forces separate |
| Inflationary epoch | 10⁻³⁶ – 10⁻³² s | ~10²⁷ K | Exponential expansion, seeds for structure |
| Electroweak epoch | 10⁻³² – 10⁻¹² s | 10¹⁵ – 10²⁸ K | Electromagnetic and weak forces separate |
| Quark epoch | 10⁻¹² – 10⁻⁶ s | 10¹² – 10¹⁵ K | Quarks and gluons form plasma |
| Hadron epoch | 10⁻⁶ – 1 s | 10¹⁰ – 10¹² K | Protons and neutrons form |
| Lepton epoch | 1 – 10 s | 10⁹ – 10¹⁰ K | Leptons dominate, neutrinos decouple |
| Photon epoch | 10 s – 380,000 yr | 10⁹ – 3000 K | Photons coupled to matter; acoustic oscillations |
| Recombination | ~380,000 yr | ~3000 K | Atoms form; CMB released |
| Dark Ages | 380,000 yr – 100 million yr | 3000 – 30 K | No stars yet; neutral hydrogen |
| Reionization | 100 million – 1 billion yr | ~30 – 10 K | First stars ionize hydrogen |
| Structure Formation | 1 billion yr – present | ~10 K – 2.7 K | Galaxies, clusters, large-scale structure evolve |
Acoustic peaks are imprinted at the end of the photon epoch. The sound horizon—the distance a sound wave can travel from the Big Bang to recombination—sets the angular scale of the first peak. Its measurement gives a direct handle on the geometry of the universe, a key prediction of inflation.
Concept: Acoustic Peaks in Detail
Definition
Acoustic peaks are the maxima in the CMB temperature angular power spectrum, occurring at multipole moments l that correspond to the harmonics of the sound horizon at recombination. They are the Fourier modes of the density perturbations that oscillated as sound waves in the early plasma.
How It Works
In the tightly coupled photon-baryon fluid, gravity compresses overdense regions while radiation pressure resists, leading to oscillations. The competition between gravity and pressure creates standing waves with wavelengths that are integer fractions of the sound horizon. At recombination, the waves are frozen, and the temperature fluctuations we observe reflect the phase of each mode. Peaks correspond to modes caught at maximum compression (odd peaks) or maximum rarefaction (even peaks).
Equation
A simple formula for the peak positions is given by Wang (2026):
l = (n − 1/4)π/θ*
where n is a positive integer, θ* is the angular acoustic scale, and l is the multipole moment. The angular acoustic scale is determined by the ratio of the sound horizon to the angular diameter distance to the last scattering surface.
Example
Using Planck 2018 cosmological parameters, the angular acoustic scale is about 1.041° (0.01818 radians). For n=1, the formula gives l ≈ (3/4)π/0.01818 ≈ 129, but the actual first peak is at l ≈ 220 because the formula uses a more precise treatment. Nevertheless, the formula captures the harmonic spacing: successive peaks are separated by roughly π/θ* ≈ 173 in l.
Observable Consequences
The positions and heights of acoustic peaks have been measured by BOOMERANG, MAXIMA, DASI, WMAP, and Planck. The first peak at l ≈ 200 strongly indicates a spatially flat universe. The relative heights of the first and second peaks constrain the baryon density, while the damping at high l (the Silk tail) reveals the matter density. These measurements have pinned down the Hubble constant, dark energy density, and the spectral index of primordial fluctuations.
Common Misconceptions
Acoustic peaks are not sound waves we can hear; they are pressure waves in a relativistic plasma. They are also not caused by stars or galaxies—they originate from the primordial density fluctuations seeded by inflation. Another misconception is that the peaks are isolated features; in reality, they are part of a continuous power spectrum that includes a background of gravitational lensing and other effects.
Why It Matters
Acoustic peaks are a powerful probe of the universe’s fundamental parameters. They provide independent confirmation of the Big Bang model and inflation, and they have been crucial in establishing the existence of dark matter and dark energy. By measuring the peaks with high precision, cosmologists have determined that the universe is flat, composed of ~5% ordinary matter, ~27% dark matter, and ~68% dark energy. The peaks also constrain the equation of state of dark energy, as shown by Baccigalupi et al. (2002). Without acoustic peaks, our understanding of the universe’s composition and fate would be far less certain.
Evidence / Sources
The existence and properties of acoustic peaks have been confirmed by multiple independent experiments. The BOOMERANG, MAXIMA, and DASI measurements in the early 2000s provided the first clear detections of the first and second peaks (Durrer et al., 2003). WMAP and Planck later mapped the full CMB sky with unprecedented resolution, revealing the detailed acoustic structure. The formula for peak positions is derived from the physics of acoustic oscillations (Hu & White, 1996).
Related Registry Entries
Last Reviewed: September 5, 2026
FAQ
What causes acoustic peaks in the CMB?
Acoustic peaks arise from sound waves in the tightly coupled photon-baryon plasma of the early universe. Gravity compresses overdense regions while radiation pressure resists, creating oscillations that freeze at recombination, leaving a periodic pattern in the CMB temperature power spectrum.
Why do the heights of acoustic peaks differ?
The relative heights depend on the baryon density and dark matter density. Baryons enhance compression, boosting odd peaks, while dark matter enhances rarefaction, boosting even peaks. The overall damping at high multipoles is due to photon diffusion (Silk damping).
How do acoustic peaks constrain cosmological models?
The positions of the peaks depend on the geometry of the universe (curvature) and the expansion history. The heights depend on the baryon and dark matter densities. By fitting the observed power spectrum, cosmologists can determine these parameters and test models like ΛCDM.
Leave a Reply