Short Answer
Main Explanation
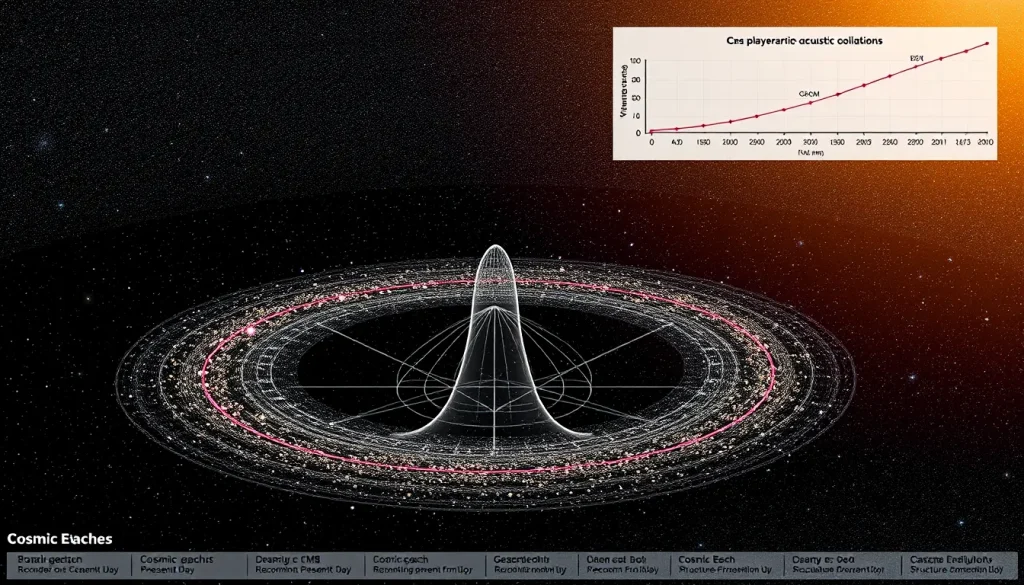
Baryon acoustic oscillations (BAOs) are a subtle, periodic clustering of matter imprinted by sound waves that traveled through the hot plasma of the early universe before recombination. These waves, driven by the interplay between gravitational attraction and radiation pressure, left a characteristic scale—about 150 megaparsecs (Mpc) in comoving distance—that appears as a slight excess in the probability of finding galaxy pairs separated by that distance. Galaxy surveys detect this excess by mapping the three-dimensional distribution of galaxies and measuring its statistical properties, most commonly via the two-point correlation function or its Fourier transform, the power spectrum.
The detection of BAOs at the expected scale strongly supports the standard cosmological model (ΛCDM), which posits a universe dominated by dark energy and cold dark matter, with a nearly scale-invariant spectrum of primordial fluctuations. Because the BAO scale was set by known physics in the early universe, it serves as a standard ruler: comparing its apparent size at different redshifts allows cosmologists to measure the expansion history of the universe and constrain the properties of dark energy.
How Galaxy Surveys Detect BAOs
Modern galaxy surveys—such as the Sloan Digital Sky Survey (SDSS), the Dark Energy Survey (DES), the Dark Energy Spectroscopic Instrument (DESI), and the upcoming Euclid and LSST (Vera C. Rubin Observatory)—collect spectroscopic or photometric redshifts for millions of galaxies. From these, they construct a three-dimensional map of the large-scale structure. The BAO signal is faint, only a ~1% modulation in the clustering amplitude, so surveys must cover enormous volumes and use careful statistical techniques to extract it.
The primary method is to compute the two-point correlation function ξ(s), which measures the excess probability of finding a galaxy at a distance s from another galaxy compared to a random distribution. In the correlation function, the BAO appears as a broad peak at s ≈ 150 Mpc. Alternatively, the power spectrum P(k) (the Fourier transform of the correlation function) shows a series of damped oscillations, with the first peak corresponding to the BAO scale. Both methods require modeling the broadband shape of clustering to isolate the BAO feature, often using templates from linear perturbation theory and marginalizing over nuisance parameters like galaxy bias and redshift-space distortions.
As emphasized by Labatie et al. (2012), the detection of BAOs is not a single measurement but a statistical inference. The significance of the detection depends on the survey’s volume, galaxy number density, and the accuracy of redshift measurements. Spectroscopic surveys provide precise redshifts and thus sharper BAO peaks, while photometric surveys sacrifice radial precision but can cover larger areas. Hernández-Aguayo et al. (2020) showed that the choice of galaxy selection (e.g., color, luminosity) can slightly shift the apparent BAO peak position, a systematic effect that must be modeled.
Measurement Details
Here we summarize the key aspects of BAO measurement, following the framework of Ferreira & Reis (2024).
- Value: The BAO scale is approximately 150 Mpc in comoving distance (or equivalently, a redshift-space distortion corrected scale). The exact value depends on the cosmological model, with current constraints from Planck and galaxy surveys giving r_d ≈ 147 Mpc (the comoving sound horizon at the drag epoch).
- Units: Megaparsecs (Mpc) for distance; the power spectrum uses inverse Mpc (h/Mpc) or Mpc3 for amplitude.
- Instrument: Large galaxy surveys with spectroscopic or photometric capability, e.g., SDSS BOSS, DESI, Euclid, LSST, and the Dark Energy Survey.
- Method: Measure the correlation function or power spectrum from a galaxy redshift catalog, fit a model that includes the BAO feature (often using a template from camb or class), and extract the peak position or the acoustic scale parameter α.
- Uncertainty: Dominated by cosmic variance (limited survey volume), shot noise (finite galaxy density), and systematic effects such as redshift errors, galaxy bias, and nonlinear structure growth. Current surveys achieve ~1% precision on the BAO scale.
- Dataset: The most precise measurements come from the Baryon Oscillation Spectroscopic Survey (BOSS) and its successor eBOSS, with DESI now providing even tighter constraints.
- Latest/Reference Measurement: As of 2024, DESI’s first-year data release has measured the BAO scale at multiple redshifts with sub-percent precision, consistent with ΛCDM predictions (Ferreira & Reis, 2024).
- Why Measurements Differ: Differences among surveys arise from variations in galaxy selection, redshift accuracy, analysis pipelines, and assumed fiducial cosmology. The BAO peak position can shift if the fiducial model used to convert redshifts to distances is incorrect, a common source of systematic error.
Cosmic Epochs: A Timeline
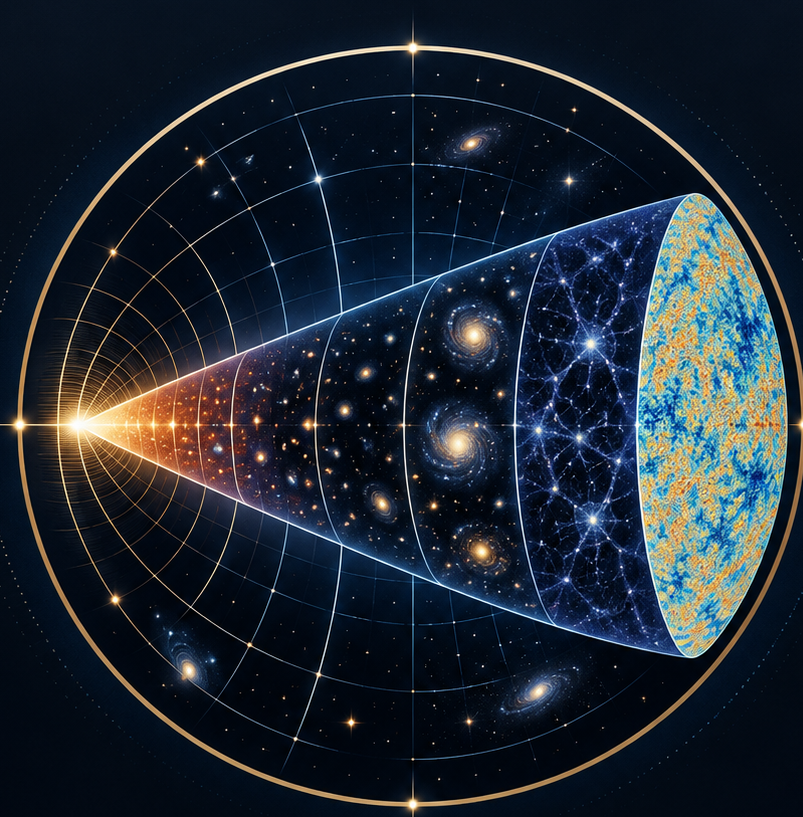
BAOs originate in the early universe, but to understand them fully we must place them in the context of cosmic evolution. The table below summarizes the major epochs from the Big Bang to the present day, as described in the standard ΛCDM model.
| Epoch | Time After Big Bang | Temperature | Redshift | Key Events |
|---|---|---|---|---|
| Planck epoch | < 10-43 s | > 1032 K | > 1032 | Quantum gravity effects dominate; no known physics. |
| Grand Unification epoch | 10-43 to 10-36 s | 1032 to 1028 K | 1032 to 1028 | Strong and electroweak forces unify; possible inflation trigger. |
| Inflationary epoch | 10-36 to 10-32 s | ~1028 K | ~1028 | Exponential expansion; quantum fluctuations seeded structure. |
| Electroweak epoch | 10-32 to 10-12 s | 1028 to 1015 K | 1028 to 1015 | Electromagnetic and weak forces separate; W, Z bosons acquire mass. |
| Quark epoch | 10-12 to 10-6 s | 1015 to 1012 K | 1015 to 1012 | Quarks and gluons form quark-gluon plasma; no hadrons yet. |
| Hadron epoch | 10-6 to 1 s | 1012 to 1010 K | 1012 to 1010 | Quarks combine into protons and neutrons; matter-antimatter asymmetry forms. |
| Lepton epoch | 1 to 10 s | 1010 to 109 K | 1010 to 109 | Leptons dominate; neutrinos decouple. |
| Photon epoch | 10 s to ~380,000 yr | 109 to 3000 K | 109 to ~1100 | Photons dominate; primordial nucleosynthesis creates light elements. |
| Recombination | ~380,000 yr | ~3000 K | ~1100 | Electrons combine with protons to form neutral hydrogen; photons decouple, releasing the CMB. |
| Dark Ages | 380,000 yr to ~150 million yr | 3000 to ~50 K | 1100 to ~20 | No stars; universe dark except for CMB and residual radiation. |
| Reionization | ~150 million to ~1 billion yr | ~50 to ~10 K | 20 to 6 | First stars and galaxies form; ultraviolet light reionizes neutral hydrogen. |
| Structure Formation | 1 billion yr to present | < 10 K | < 6 | Galaxies cluster into large-scale structure; dark energy accelerates expansion. |
The BAO signal we detect today was imprinted during the photon epoch, when acoustic waves propagated in the photon-baryon fluid. At recombination, the waves froze, leaving a characteristic separation between regions of slightly higher density that later seeded galaxy formation. This is why the BAO scale is directly tied to the sound horizon at recombination, making it an ideal standard ruler.
Why It Matters
BAO measurements are a cornerstone of modern cosmology. They provide a direct, geometric probe of the expansion history of the universe, independent of the cosmic distance ladder. By measuring the BAO scale at different redshifts, astronomers can constrain the equation of state of dark energy, the Hubble constant, and the curvature of space. The consistency of BAO results with other probes—such as supernovae, CMB anisotropies, and weak lensing—strengthens the ΛCDM model and helps rule out alternative theories of gravity.
Moreover, BAOs are essential for understanding the growth of structure. The subtle clustering pattern they imprint is a fossil of the conditions in the early universe, offering a direct link between the physics of the primordial plasma and the distribution of galaxies we observe today. As surveys like DESI and Euclid push to higher precision, BAO measurements will continue to test the standard model and potentially reveal deviations that point to new physics.
Evidence / Sources
The following sources provide authoritative information on BAO detection and cosmic evolution:
- Labatie, A., Starck, J. L., & Lachièze-Rey, M. (2012). “Detecting Baryon Acoustic Oscillations.” The Astrophysical Journal, 746(2), 172. doi:10.1088/0004-637X/746/2/172
- Ferreira, P. S., & Reis, R. R. R. (2024). “Baryon Acoustic Oscillations from galaxy surveys.” Brazilian Journal of Physics. arXiv:2412.04405
- Zhan, H., et al. (2009). “Large-Scale Structure and Baryon Oscillations.” LSST Science Book, Chapter 13. LSST Science Book
- Hernández-Aguayo, C., et al. (2020). “Measuring the baryon acoustic oscillation peak position with different galaxy selections.” Monthly Notices of the Royal Astronomical Society. arXiv:1912.01099
Related Registry Entries
- Baryon Acoustic Oscillations (BAO)
- Cosmic Microwave Background (CMB)
- Large-Scale Structure
- Cosmic Timeline
- Dark Energy
Last Reviewed / Updated: September 5, 2026
FAQ
What exactly are baryon acoustic oscillations?
BAOs are regular, periodic fluctuations in the density of baryonic matter in the early universe, caused by sound waves traveling through the hot plasma before recombination. They left a characteristic scale of about 150 Mpc that appears as a subtle excess in galaxy clustering at that separation.
How do galaxy surveys detect the BAO signal?
Surveys map the 3D distribution of galaxies and compute the two-point correlation function or power spectrum. The BAO appears as a peak at ~150 Mpc (or as oscillations in the power spectrum). The detection requires large volumes and careful modeling of the broadband clustering.
Why is the BAO scale called a standard ruler?
The BAO scale was set by known physics in the early universe (the sound horizon at recombination). By measuring its apparent angular or radial size at different redshifts, astronomers can measure the expansion history and constrain dark energy.
What do BAO measurements tell us about dark energy?
BAO measurements provide geometric constraints on the expansion rate as a function of redshift, which is sensitive to the equation of state of dark energy. They have helped confirm that dark energy behaves like a cosmological constant, with w ≈ -1.
Are BAO detections affected by galaxy selection?
Yes, studies like Hernández-Aguayo et al. (2020) show that the apparent BAO peak position can shift slightly depending on galaxy properties (e.g., luminosity, color). This systematic must be modeled to avoid biased cosmological constraints.
Leave a Reply