Short Answer
Main Explanation
The cosmic microwave background (CMB) is the oldest light directly observable, a fossil from when the universe was just 380,000 years old. Discovered accidentally in 1965 by Arno Penzias and Robert Wilson, it transformed cosmology from speculation to precision science. Each tiny wrinkle in its temperature and polarization encodes information about the universe’s contents, geometry, and history. Think of the CMB as a dense, information-rich map. This guide explains how to read it.
Modern CMB maps are not photographs but statistical reconstructions from time-ordered data collected by telescopes. Map-making compresses raw time samples into sky maps at observed frequencies, a procedure that reduces data volumes from 1012–1014 time samples to manageable maps. Analysis procedures such as masking, downgrading resolution, convolving with beam and pixel window functions, and adding noise affect the final power spectrum measured from a map. Reading a CMB map means interpreting angular patterns: hot and cold spots of about one part in 100,000, the acoustic peaks in the angular power spectrum, and polarization patterns imprinted by the last scattering and reionization.
Concept: Reading the CMB Map
Definition
A CMB map is an all-sky image of microwave brightness temperature, nearly uniform at 2.725 K, with small anisotropies that trace primordial density fluctuations at the epoch of recombination.
How It Works
For its first few hundred thousand years, the universe was a hot plasma of free electrons, protons, and photons interacting constantly. Photons could not travel far without scattering. As the universe expanded and cooled to about 3000 K, protons and electrons combined to form neutral hydrogen, and photons decoupled. These photons have been redshifted by the expansion of space from about 3000 K to 2.725 K today. The angular scale of a fluctuation on the map is related to its physical size at last scattering through the angular diameter distance, which depends on cosmic geometry and expansion history.
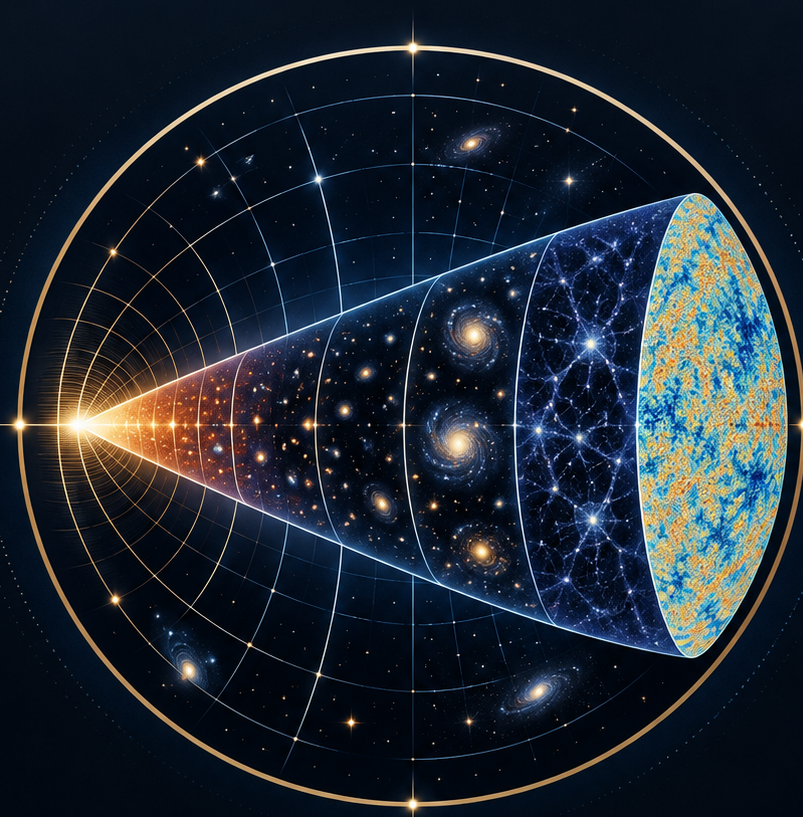
The following timeline summarizes the major cosmic epochs from the Planck era to the present. Reading a CMB map is essentially reading the boundary condition set at recombination, but the map also carries imprints of earlier physics through the initial fluctuation spectrum and later physics through gravitational lensing and reionization.
| Epoch | Time after Big Bang | Temperature | Approx. Redshift | Key Events |
|---|---|---|---|---|
| Planck epoch | <10⁻⁴³ s | >10³² K | ~∞ | Quantum gravity; all forces possibly unified |
| Grand Unification epoch | 10⁻⁴³–10⁻³⁶ s | 10²⁹–10²⁷ K | ~10²⁸ | Strong force separates; possible baryogenesis |
| Inflationary epoch | 10⁻³⁶–10⁻³² s | ~10²⁷ K | ~10²⁶ | Rapid exponential expansion; seeds of structure |
| Electroweak epoch | 10⁻³²–10⁻¹² s | 10¹⁵ K | ~10¹⁵ | Weak and electromagnetic forces separate |
| Quark epoch | 10⁻¹²–10⁻⁶ s | 10¹² K | ~10¹² | Quarks, leptons, gluons in quark-gluon plasma |
| Hadron epoch | 10⁻⁶–1 s | 10¹⁰ K | ~10¹⁰ | Quarks bind into protons and neutrons |
| Lepton epoch | 1 s–10 s | 10⁹ K | ~10⁹ | Neutrinos decouple; electron-positron annihilation |
| Photon epoch | 10 s–380,000 yr | 10⁹–3000 K | 10⁹–1100 | Big Bang nucleosynthesis; plasma of nuclei, electrons, photons |
| Recombination | ~380,000 yr | ~3000 K | ~1100 | First atoms form; CMB released |
| Dark Ages | 380,000 yr–~150 million yr | 3000–~50 K | 1100–~20 | Neutral hydrogen; no stars yet |
| Reionization | ~150 million–1 billion yr | ~50–20 K | ~20–6 | First stars and galaxies ionize intergalactic gas |
| Structure Formation | ~1 billion yr–present | 20–2.725 K | 6–0 | Galaxies, clusters, large-scale structure grow |
Note: times, temperatures, and redshifts are approximate and model-dependent; the standard ΛCDM model is assumed.
Equation
The CMB temperature field is expanded in spherical harmonics: ΔT(θ,φ)/T = Σ almYlm(θ,φ). The angular power spectrum is Cl = ⟨|alm|²⟩. On large angular scales, the Sachs-Wolfe effect gives ΔT/T ≈ −Φ/3, where Φ is the gravitational potential.
Example
In a Planck map, the characteristic red and blue spots are not noise but real temperature differences of about 100 microkelvin. The first acoustic peak at multipole l≈200 corresponds to the sound horizon at recombination; its position indicates a nearly flat universe. The relative heights of the odd and even peaks encode the baryon density, while the damping tail constrains the primordial helium abundance and neutrino properties.
Observable Consequences
- The CMB map shows a nearly scale-invariant spectrum of primordial fluctuations, as predicted by inflation.
- The positions and amplitudes of acoustic peaks measure the universe’s geometry, baryon density, dark matter density, and expansion rate.
- Polarization E-modes and B-modes trace reionization and potentially primordial gravitational waves.
- Gravitational lensing of the CMB by large-scale structure maps the distribution of dark matter.
Common Misconceptions
- The CMB is the Big Bang itself. It is the afterglow from 380,000 years later, not the initial singularity.
- The map is a photograph. It is a statistical reconstruction from time-ordered data, with instrumental effects removed.
- The CMB is perfectly uniform. It has tiny anisotropies of about 1 part in 100,000, which are the seeds of all cosmic structure.
- Redshift means galaxies are moving through space. In cosmology, redshift is mainly due to the expansion of space itself.
Why It Matters
The CMB map is the most precise observational foundation of the standard ΛCDM cosmological model. It links quantum fluctuations generated during inflation to the galaxies, clusters, and voids we see today. By reading the map’s statistical properties, cosmologists measure the age, composition, and geometry of the universe, test inflation, and search for new physics such as primordial gravitational waves or deviations from Gaussianity.
Evidence / Sources
Key missions and instruments have progressively sharpened our reading of the CMB. COBE first detected the blackbody spectrum and large-angle anisotropies in 1992. WMAP measured the acoustic peaks and established the ΛCDM model. Planck mapped the full sky with higher resolution and sensitivity, refining cosmological parameters. JWST, while not a CMB instrument, probes the later epochs of reionization and first galaxies, complementing the CMB timeline. The map-making and analysis methods described here follow standard practices in the field.
Related Registry Entries
Last reviewed / updated: September 8, 2026.
FAQ
What exactly is a CMB map?
A CMB map is an all-sky image of microwave brightness temperature, showing tiny fluctuations around 2.725 K that trace density variations at the time the universe became transparent.
Why are there hot and cold spots?
They correspond to regions of slightly higher and lower density at recombination. Photons from denser regions lost more energy climbing out of gravitational wells, appearing cooler, while under-dense regions appear warmer.
What do the acoustic peaks tell us?
The peaks in the angular power spectrum are the imprint of sound waves in the early plasma. Their positions and heights measure the universe's geometry, baryon density, and dark matter density.
How do COBE, WMAP, and Planck differ?
COBE first detected the anisotropies, WMAP measured the acoustic peaks with higher resolution, and Planck mapped the full sky with even greater sensitivity and angular resolution, refining cosmological parameters.
Leave a Reply