Short Answer
Main Explanation
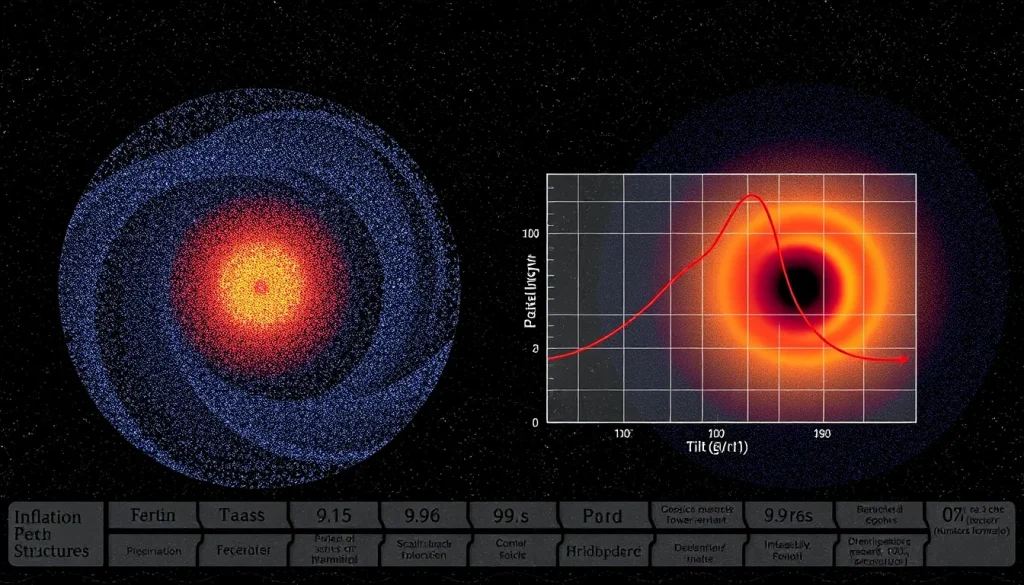
The spectral index, denoted ns, is a fundamental parameter in physical cosmology. It describes how the amplitude of primordial density fluctuations—the tiny quantum seeds that later grew into galaxies and clusters—depends on the scale at which they are observed. In the standard ΛCDM (Lambda Cold Dark Matter) model, the power spectrum of these scalar perturbations is approximated as a power law: P(k) ∝ kns−1, where k is the wavenumber (inverse of spatial scale). When ns = 1, the fluctuations are perfectly scale-invariant: the gravitational potential has the same amplitude on all physical scales. Any deviation from unity introduces a tilt, making fluctuations slightly stronger on either large or small scales.
Definition and Role in the Power Spectrum
The scalar spectral index is a measure of the departure from scale invariance. As NASA’s LAMBDA (Legacy Archive for Microwave Background Data Analysis) resource explains, “Scale invariance is indicated when the scalar index ns is identically one, e.g., the power in the primordial gravitational potential fluctuations is the same over all physical scales.” In practice, the index is defined such that the primordial power spectrum of curvature perturbations is Pζ(k) = As (k/k*)ns−1, where As is the amplitude and k* is a pivot scale (often chosen as 0.05 Mpc−1). This parameter directly shapes the temperature and polarization anisotropies of the cosmic microwave background (CMB) and the matter power spectrum at later times.
Inflation and the Prediction of ns < 1
Inflation—the epoch of exponential expansion in the first fraction of a second—provides a natural explanation for the nearly scale-invariant spectrum. Quantum fluctuations during inflation are stretched to cosmological scales, and because the inflationary potential is not perfectly constant but slowly rolls, the fluctuations acquire a slight red tilt: ns is slightly less than 1. As the LAMBDA page notes, “In general, inflation predicts values slightly less than 1: this is a consequence of a slowly varying inflationary potential and horizon size over the period of inflation.” This prediction was spectacularly confirmed by the Planck satellite, which measured ns ≈ 0.96 (with an uncertainty of about 0.004), a 5-sigma deviation from unity. This is often cited as one of the strongest pieces of evidence for inflation.
How ns Shapes the Cosmic Microwave Background
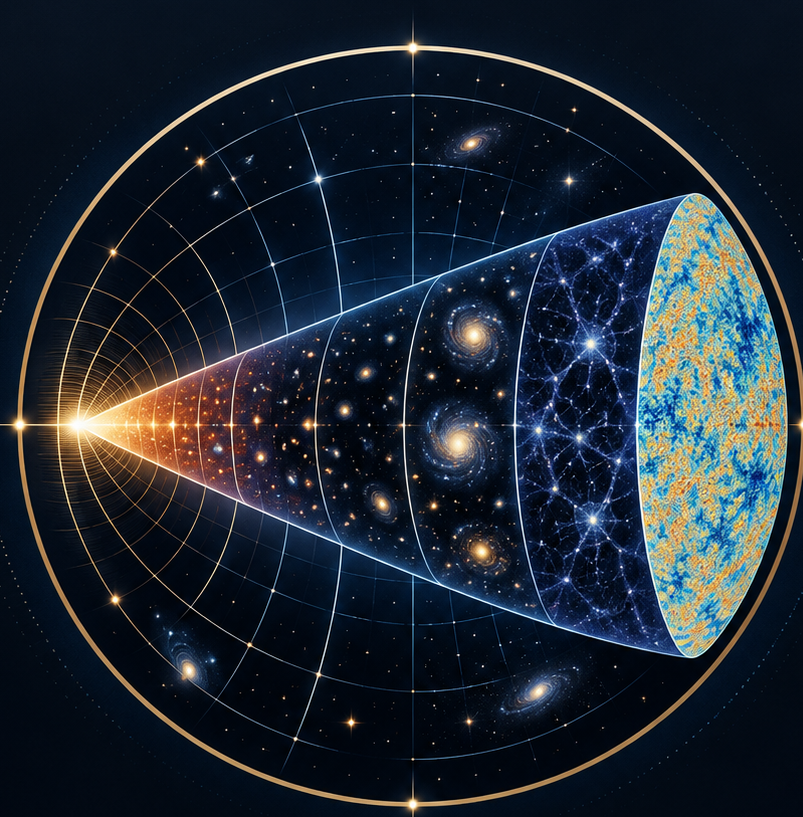
The CMB is a snapshot of the universe when it was about 380,000 years old, at the moment of recombination. The temperature fluctuations in the CMB map directly reflect the primordial density perturbations. A smaller ns means relatively more power on small scales (high k), which boosts the amplitude of the acoustic peaks at high multipoles (ℓ) in the CMB angular power spectrum. Conversely, a larger ns suppresses small-scale power. By fitting the measured CMB power spectrum to theoretical models, cosmologists can extract ns with high precision. The Planck mission, along with earlier COBE and WMAP observatories, has provided the most accurate determinations to date.
A Timeline of Cosmic Epochs
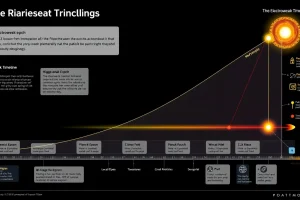
To appreciate where ns fits into cosmic history, it helps to review the sequence of epochs from the very beginning to the present. The table below summarizes the major phases, from the Planck epoch through structure formation.
| Epoch | Time After Big Bang | Key Events |
|---|---|---|
| Planck epoch | < 10−43 s | Quantum gravity effects dominate; no known physics. |
| Grand Unification epoch | 10−43 – 10−36 s | Strong and electroweak forces unify; inflation begins near the end. |
| Inflationary epoch | 10−36 – 10−32 s | Exponential expansion; quantum fluctuations seeded; ns determined. |
| Electroweak epoch | 10−32 – 10−12 s | Electromagnetic and weak forces separate; particle masses emerge. |
| Quark epoch | 10−12 – 10−6 s | Quarks and gluons form a quark-gluon plasma. |
| Hadron epoch | 10−6 – 1 s | Quarks combine into protons and neutrons; matter-antimatter annihilation. |
| Lepton epoch | 1 – 10 s | Leptons dominate; neutrinos decouple. |
| Photon epoch | 10 s – 380,000 yr | Photons tightly coupled to baryons; primordial nucleosynthesis. |
| Recombination | ~380,000 yr | Electrons combine with protons to form neutral hydrogen; CMB released. |
| Dark Ages | 380,000 yr – ~150 million yr | No stars yet; universe is dark and neutral. |
| Reionization | ~150 million – 1 billion yr | First stars and galaxies ionize hydrogen. |
| Structure Formation | 1 billion yr – present | Gravity amplifies initial density fluctuations into galaxies, clusters, and large-scale structure. |
The value of ns directly influences the statistical properties of the initial density field that seeded all these structures. A tilt away from unity means that the first objects (small-scale overdensities) form slightly earlier or later than they would in a perfectly scale-invariant universe.
Measurement of ns
Value
The current best estimate from the Planck 2018 data release (combined with BAO and lensing) is ns = 0.9649 ± 0.0042. Earlier Planck results gave 0.9603 ± 0.0073, and WMAP reported 0.9608 ± 0.0080. All are consistent with a value around 0.96, significantly less than 1.
Units
The spectral index is dimensionless; it is a pure number. It is often expressed with a pivot scale k* = 0.05 Mpc−1 (or sometimes 0.002 Mpc−1), but the index itself has no units.
Instrument
Measurements come primarily from space-based CMB observatories: NASA’s COBE (1989–1993), WMAP (2001–2010), and ESA’s Planck (2009–2013). Planck’s high-resolution, multi-frequency observations have provided the most precise constraints. Ground-based experiments like ACT and SPT also contribute, and future missions such as Simons Observatory and CMB-S4 will further refine the value.
Method
The spectral index is determined by fitting a theoretical CMB power spectrum (computed using Boltzmann codes like CAMB or CLASS) to the observed temperature and polarization angular power spectra. The fit includes cosmological parameters such as the baryon density, dark matter density, Hubble constant, and optical depth, with ns marginalized over. The shape of the acoustic peaks and the damping tail at high ℓ are particularly sensitive to ns.
Uncertainty
The uncertainty on ns is now below 0.005, dominated by cosmic variance at low multipoles and instrumental noise at high multipoles. Systematic errors from foreground emission and calibration are carefully controlled. The quoted error includes statistical and systematic contributions added in quadrature.
Dataset
The primary dataset is the Planck 2018 release, which includes temperature and polarization maps from the Low Frequency Instrument (LFI) and High Frequency Instrument (HFI). WMAP’s nine-year data also provide a cross-check. The Planck legacy papers (e.g., Planck Collaboration 2020) give the full likelihood and parameter chains.
Latest/Reference Measurement
As of 2025, the Planck 2018 value of ns = 0.9649 ± 0.0042 (TT,TE,EE+lowE+lensing+BAO) is the standard reference. The upcoming CMB-S4 experiment aims to reduce the uncertainty to about 0.002, potentially detecting a running of the spectral index.
Why Measurements Differ
Small differences between experiments (e.g., WMAP vs. Planck) arise from different sky coverage, frequency bands, calibration, and foreground modeling. Adding non-CMB datasets like BAO or lensing can shift the best-fit value slightly. However, all measurements agree within about 1–2 sigma, confirming the robustness of the result.
Why It Matters
The spectral index is not just a number; it is a direct probe of the physics of inflation. Different inflationary models predict specific values of ns and its running (dns/dlnk). A measurement of ns = 0.96 rules out exact scale invariance (e.g., de Sitter inflation) and strongly favors single-field slow-roll models with a small tilt. It also affects the formation of structure: a smaller ns means more small-scale power, leading to earlier formation of dwarf galaxies and reionization. Understanding ns helps us connect the quantum fluctuations of the early universe to the observed distribution of galaxies today.
Evidence / Sources
The authoritative resources used in this article include NASA’s LAMBDA website, which explains the scalar spectral index in the context of ΛCDM; a Physics Stack Exchange discussion on inflation and the spectral index; an MIT lecture on the power spectrum; and a pedagogical review of quantum de Sitter observables that discusses the theoretical underpinnings of ns. These sources are listed in the references below.
Related Registry Entries
Explore more entries in the cosmic reference library: the Cosmic Microwave Background, Inflation, the Power Spectrum, and the ΛCDM model. Each entry provides deeper context for understanding how ns fits into the grand story of the universe.
FAQ
What does n_s = 1 mean?
It means the primordial density fluctuations are perfectly scale-invariant: the amplitude of fluctuations is the same on all physical scales. This is the exact de Sitter limit, but inflation predicts a slight deviation.
Why is n_s less than 1?
During inflation, the scalar field driving expansion slowly rolls down its potential, causing the horizon size to change slightly. This breaks exact scale invariance and produces a red tilt, so n_s < 1.
How is n_s measured?
By fitting the observed CMB temperature and polarization power spectra to theoretical models. The shape of the acoustic peaks and damping tail is sensitive to n_s, allowing precise extraction.
What does n_s tell us about inflation?
The measured value of n_s ≈ 0.96 rules out perfectly scale-invariant models and strongly supports single-field slow-roll inflation. It also constrains the shape of the inflationary potential and the physics of the very early universe.


Leave a Reply