Short Answer
Main Explanation
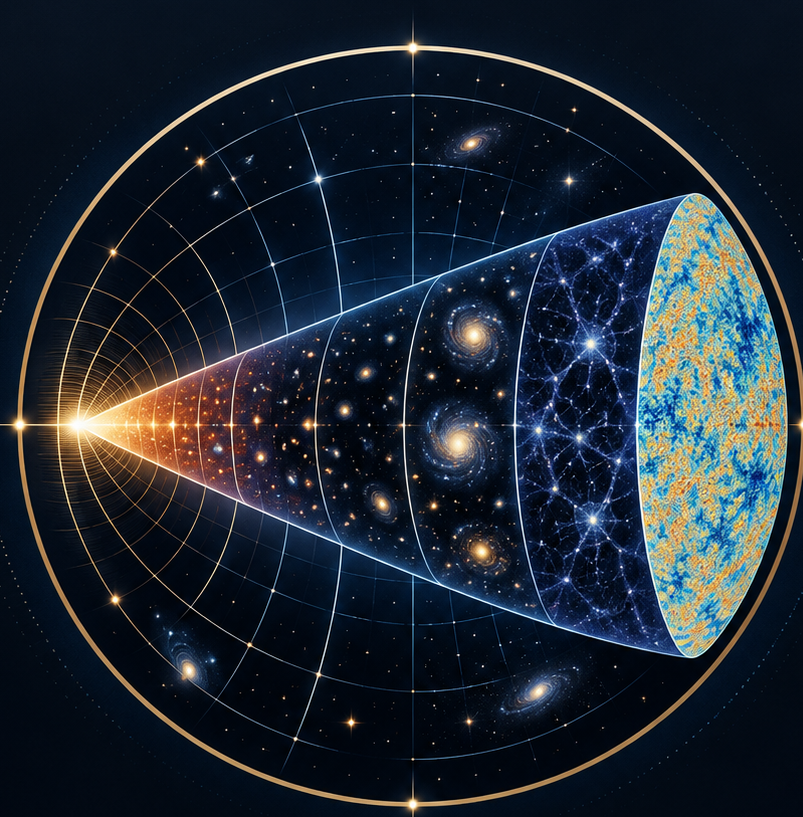
The cosmic microwave background (CMB) is the oldest light in the universe, a relic of the hot, dense state that existed about 380,000 years after the Big Bang. Imprinted on this radiation are tiny temperature fluctuations—at the level of one part in 100,000—that contain a wealth of cosmological information. Among the most powerful features are the acoustic peaks in the power spectrum of these fluctuations. These peaks are the fossilized remnants of sound waves that propagated through the photon-baryon fluid in the early universe. Their positions and heights allow cosmologists to measure the density, curvature, and composition of the universe with remarkable precision.
The story begins with the interplay between gravity and pressure. Before recombination, photons were tightly coupled to baryons (protons and electrons) via Thomson scattering, creating a single fluid. Density perturbations—quantum fluctuations amplified by inflation—created regions of slightly higher and lower density. Gravity pulled matter into overdense regions, while radiation pressure pushed it out, setting up oscillations. These sound waves traveled at roughly half the speed of light, with a characteristic distance known as the sound horizon—the maximum distance a wave could travel by the time of recombination.
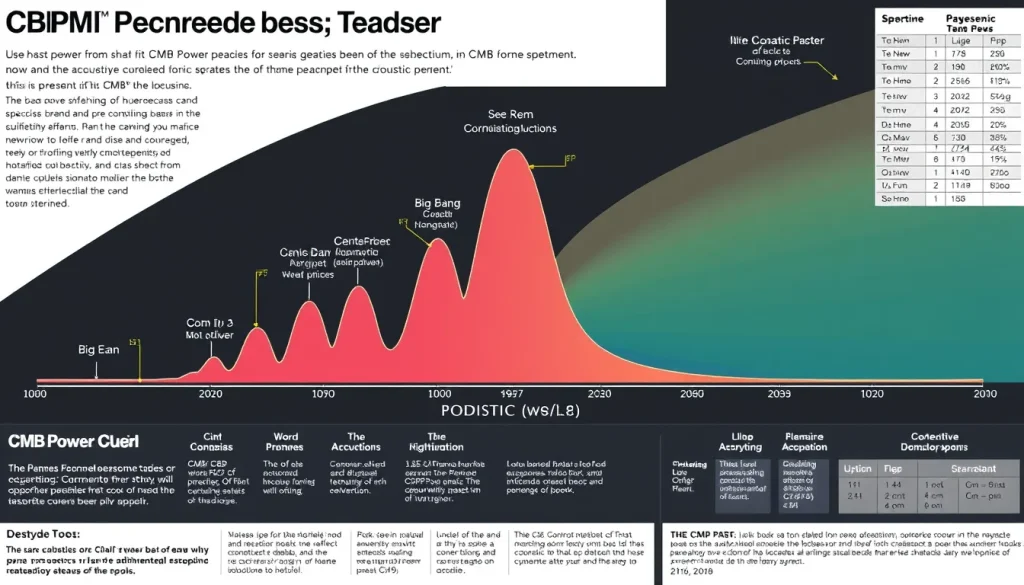
When the universe cooled enough for electrons and protons to combine into neutral hydrogen, the photons decoupled and streamed freely. The patterns of compression and rarefaction at that moment were frozen into the CMB. In the power spectrum (a plot of temperature variance as a function of angular scale), these oscillations appear as a series of peaks. The first peak corresponds to the mode that completed one half-oscillation—a compression—at recombination. The second peak corresponds to a full oscillation (compression then rarefaction), and so on.
Curvature and the First Peak
The angular scale of the first peak is a direct probe of the spatial curvature of the universe. The sound horizon had a known physical size at recombination (about 150 megaparsecs). Its apparent angular size depends on the geometry of space. In a flat universe, the peak appears at a multipole moment of roughly ℓ ≈ 220 (an angular scale of about 1 degree). In an open universe (negative curvature), light rays diverge, making the same physical scale appear smaller on the sky, so the peak shifts to higher ℓ (smaller angles). In a closed universe (positive curvature), the peak shifts to lower ℓ. As noted in the MIT lecture notes, this effect is essentially independent of other parameters, making the first peak a clean measure of Ωk (the curvature density parameter).
Matter Density and the Timing Effect
One might naively think that a higher matter density would lead to stronger gravitational compression and thus larger peaks. However, the dominant effect is the timing of recombination. A universe with more matter (higher Ωm) has a younger age at a given redshift, so the sound horizon has had less time to evolve, and the oscillations are caught at a different phase. As a result, the heights and positions of the peaks shift in a characteristic way. The first peak’s height increases with Ωm, while the second peak’s height decreases, altering the ratio of peak heights.
Baryon Density and Odd-Even Peaks
The baryon density Ωb affects the acoustic oscillations through the inertia of the fluid. Baryons add mass to the photon-baryon fluid, making it harder for radiation pressure to push it outward. This enhances every other compression (odd peaks) and suppresses rarefactions (even peaks). Thus, the ratio of the first to second peak heights is a sensitive measure of Ωb. This is why cosmologists can determine the baryon density from the CMB alone, without relying on nucleosynthesis calculations.
Dark Energy and the Hubble Constant
While the acoustic peaks primarily constrain Ωk, Ωm, and Ωb, the overall shape of the spectrum also depends on the dark energy density ΩΛ and the Hubble constant H0. These parameters affect the angular diameter distance to the last scattering surface, which shifts all peaks. However, the degeneracies can be broken by combining CMB data with other observations like supernovae and baryon acoustic oscillations.
Cosmic Epochs: From Planck to Present
The CMB acoustic peaks are the culmination of a long sequence of cosmic epochs. The standard ΛCDM model describes a universe that began in a hot, dense state and evolved through distinct phases. The following table summarizes the major epochs, their approximate times, temperatures, and key events.
| Epoch | Time After Big Bang | Temperature | Key Events |
|---|---|---|---|
| Planck Epoch | <10-43 s | >1032 K | Quantum gravity effects; all forces unified |
| Grand Unification Epoch | 10-43 to 10-36 s | 1028–1032 K | Strong force separates from electroweak |
| Inflationary Epoch | 10-36 to 10-32 s | ~1028 K | Exponential expansion; quantum fluctuations seeded |
| Electroweak Epoch | 10-32 to 10-12 s | 1016–1028 K | Electromagnetic and weak forces separate |
| Quark Epoch | 10-12 to 10-6 s | 1012–1016 K | Quarks and gluons form quark-gluon plasma |
| Hadron Epoch | 10-6 to 1 s | 1010–1012 K | Protons and neutrons form |
| Lepton Epoch | 1 to 10 s | 109–1010 K | Lepton-antilepton pairs dominate; neutrinos decouple |
| Photon Epoch | 10 s to 380,000 yr | 104–109 K | Photons dominate; nucleosynthesis occurs |
| Recombination | ~380,000 yr | ~3000 K | Electrons combine with protons; CMB released |
| Dark Ages | 380,000 to ~150 million yr | ~100–3000 K | No luminous sources; neutral hydrogen |
| Reionization | ~150 million to 1 billion yr | ~10–100 K | First stars and galaxies ionize hydrogen |
| Structure Formation | 1 billion yr to present | 2.7 K (now) | Galaxies, clusters, large-scale structure form |
The CMB acoustic peaks are directly linked to the conditions at recombination, which is why they serve as a powerful probe of the parameters that governed the universe at that time.
Key Missions and Instruments
Our ability to measure the acoustic peaks with precision comes from a series of space missions. The COBE satellite (1989) first detected the CMB temperature fluctuations, providing a rough spectrum. The WMAP mission (2001–2010) mapped the full sky with higher resolution, pinpointing the first peak and constraining the curvature. The Planck satellite (2009–2013) achieved even higher sensitivity and resolution, measuring the peaks to exquisite precision. Planck’s data, combined with other probes, have determined that Ωk = 0.001 ± 0.002, consistent with a flat universe. The James Webb Space Telescope (JWST) is now probing the era of reionization and first galaxies, complementing CMB studies.
Concept: How Acoustic Peaks Measure Density
Definition
Acoustic peaks are the series of maxima in the CMB temperature anisotropy power spectrum, corresponding to the characteristic scales of sound waves in the photon-baryon fluid at recombination.
How It Works
The peaks arise because density perturbations of different wavelengths oscillate at different frequencies. Modes that are caught at maximum compression or rarefaction at recombination produce peaks, while those caught at intermediate phases produce troughs. The physical scale of the sound horizon sets the fundamental wavelength.
Equation
A simple approximation for the location of the first peak is given by Cornish (2000): ℓ ≈ 193 [1 + (3/5)(1 – Ω0) + (1/5)(1 – h) + (1/35)ΩΛ], where Ω0 is the total density parameter, h is the Hubble constant in units of 100 km/s/Mpc, and ΩΛ is the dark energy density. This shows how curvature and dark energy shift the peak.
Example
For a flat universe with Ω0=1, h=0.7, ΩΛ=0.7, the formula gives ℓ ≈ 193 [1 + 0 + (1/5)(0.3) + (1/35)(0.7)] ≈ 193 [1 + 0.06 + 0.02] ≈ 218, close to the observed value of ~220.
Observable Consequences
The first peak’s position measures Ωk. The ratio of first to second peak heights measures Ωb. The overall amplitude and damping tail constrain Ωm and the spectral index of primordial fluctuations.
Common Misconceptions
A common misconception is that more matter means larger peaks. In reality, the timing of recombination changes, altering peak heights in a non-monotonic way. Another is that the peaks are due to “ripples” on the last scattering surface; they are actually statistical correlations in the temperature map.
Why It Matters
Measuring the density of the universe is fundamental to understanding its fate. The total density parameter Ω0 determines whether the universe is open, closed, or flat. The CMB acoustic peaks have shown that Ω0 is extremely close to 1, consistent with inflationary predictions. Moreover, the baryon density Ωb derived from the peaks matches the predictions of Big Bang nucleosynthesis, confirming our understanding of the early universe. The peaks also provide independent evidence for dark matter (through the third peak) and dark energy (through the integrated Sachs-Wolfe effect). Together, these measurements form the foundation of the ΛCDM model, which describes a universe composed of ~5% ordinary matter, ~27% dark matter, and ~68% dark energy.
Evidence / Sources
The following sources provide detailed derivations and observational results:
- MIT OpenCourseWare, 8.902 Astrophysics II, Lecture 18: Cosmology with the CMB. Link
- Cornish, N.J. (2000). “Using the acoustic peak to measure cosmological parameters.” Link
- Durrer, R., Novosyadlyj, B., & Apunevych, S. (2003). “Acoustic Peaks and Dips in the CMB Power Spectrum.” Link
- Jungman, G. et al. (1995). “Weighing the Universe with the Cosmic Microwave Background.” Link
Related Registry Entries
Explore related concepts in the Cosmic Atlas:
- Sound Horizon
- Angular Diameter Distance
- Baryon Acoustic Oscillations
- Power Spectrum
- Cosmic Curvature
FAQ
What are CMB acoustic peaks?
They are a series of peaks in the power spectrum of CMB temperature fluctuations, caused by sound waves in the early universe's photon-baryon fluid. The peaks correspond to modes that were caught at maximum compression or rarefaction at recombination.
How does curvature affect the first peak?
In an open universe, the first peak shifts to higher ℓ (smaller angular scale); in a closed universe, it shifts to lower ℓ. This makes the first peak a sensitive probe of the curvature density parameter Ωk.
Why do baryons affect the odd-even peak ratio?
Baryons add inertia to the photon-baryon fluid, enhancing compressions (odd peaks) and suppressing rarefactions (even peaks). Thus, the ratio of the first to second peak heights measures the baryon density Ωb.



Leave a Reply