Short Answer
Main Explanation
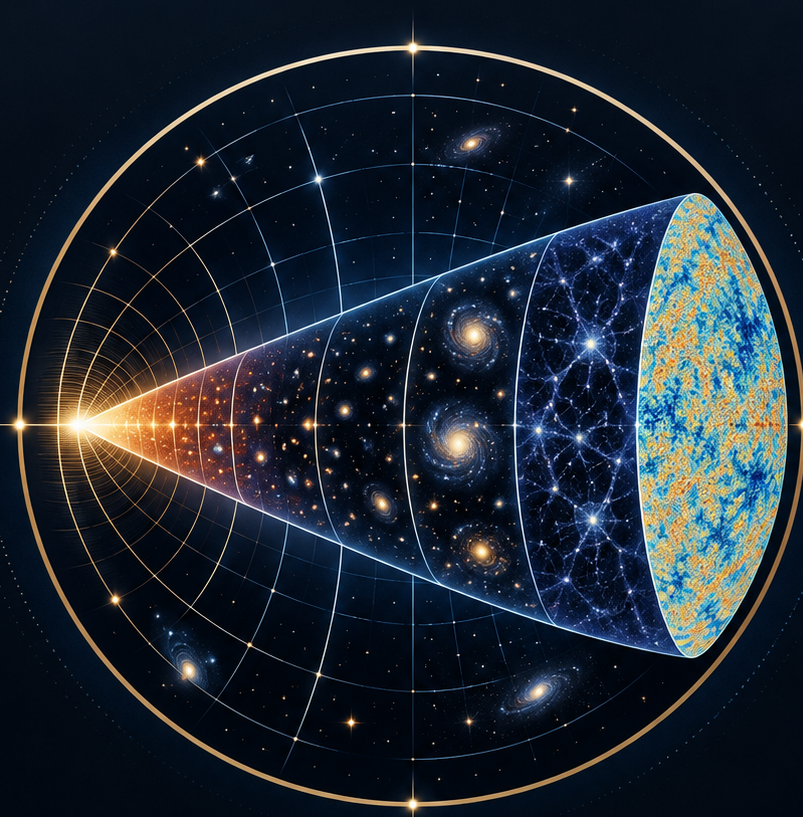
The cosmic microwave background (CMB) is the oldest light in the universe, a relic of the hot, dense state that existed shortly after the Big Bang. Its temperature fluctuations—tiny variations in the otherwise uniform glow—encode a wealth of information about the composition, geometry, and evolution of the cosmos. The CMB power spectrum is the primary tool for decoding these fluctuations, providing a quantitative map of the early universe’s density perturbations and the physics that shaped them.
When we look at the CMB, we are seeing the universe as it was about 380,000 years after the Big Bang, when photons decoupled from matter and the universe became transparent. The temperature of this radiation is almost perfectly uniform at 2.725 K, but there are variations of about one part in 100,000. These anisotropies are the seeds of all cosmic structure—galaxies, clusters, and superclusters that we observe today.
From the Planck Epoch to Structure Formation
The history of the universe is often divided into distinct epochs, each characterized by the dominant physical processes and particle species. The CMB power spectrum directly probes the conditions during the earliest of these epochs, providing a bridge between particle physics and cosmology.
| Epoch | Time After Big Bang | Temperature | Redshift | Key Events |
|---|---|---|---|---|
| Planck Epoch | < 10⁻⁴³ s | > 10³² K | — | Quantum gravity effects dominate; unification of forces. |
| Grand Unification Epoch | 10⁻⁴³ – 10⁻³⁶ s | 10²⁷ – 10³² K | — | Strong force separates from electroweak; inflation begins. |
| Inflationary Epoch | 10⁻³⁶ – 10⁻³² s | Dropping rapidly | — | Exponential expansion; quantum fluctuations stretched to cosmic scales. |
| Electroweak Epoch | 10⁻³² – 10⁻¹² s | 10¹⁵ – 10²⁷ K | — | Electromagnetic and weak forces separate; W, Z bosons acquire mass. |
| Quark Epoch | 10⁻¹² – 10⁻⁶ s | 10¹² – 10¹⁵ K | — | Quarks and gluons form a quark-gluon plasma. |
| Hadron Epoch | 10⁻⁶ – 1 s | 10¹⁰ – 10¹² K | — | Protons and neutrons form; matter-antimatter asymmetry established. |
| Lepton Epoch | 1 – 10 s | 10⁹ – 10¹⁰ K | — | Leptons dominate; neutrinos decouple. |
| Photon Epoch | 10 s – 380,000 yr | 10⁴ – 10⁹ K | z ~ 10⁹ to 1100 | Photons coupled to matter; Big Bang nucleosynthesis produces light elements. |
| Recombination | ~380,000 yr | ~3000 K | z ~ 1100 | Electrons combine with protons to form neutral hydrogen; photons decouple, creating the CMB. |
| Dark Ages | 380,000 yr – ~150 million yr | ~3000 K to ~50 K | z ~ 1100 to ~20 | The universe is dark; no stars or galaxies yet. |
| Reionization | ~150 million – 1 billion yr | ~50 K to ~10 K | z ~ 20 to ~6 | First stars and galaxies form; ultraviolet light reionizes neutral hydrogen. |
| Structure Formation | ~1 billion yr – present | Dropping to 2.7 K | z ~ 6 to 0 | Gravity amplifies density fluctuations; galaxies, clusters, and large-scale structure form. |
The CMB power spectrum is a snapshot of the universe at the moment of recombination. It reveals the amplitude and scale distribution of density perturbations that were imprinted during inflation and subsequently modified by acoustic oscillations in the photon-baryon fluid before decoupling.
Key Missions and Their Revelations
Three space missions have been pivotal in measuring the CMB power spectrum with increasing precision. The Cosmic Background Explorer (COBE), launched in 1989, first detected the anisotropies and confirmed the blackbody spectrum. The Wilkinson Microwave Anisotropy Probe (WMAP), launched in 2001, mapped the full sky with higher resolution and determined key cosmological parameters. The Planck satellite, launched in 2009, achieved the highest precision yet, refining measurements of the power spectrum’s peaks and placing stringent constraints on inflation and the composition of the universe. The James Webb Space Telescope (JWST), while not a CMB mission, has complemented these by observing the first galaxies and probing the epoch of reionization.
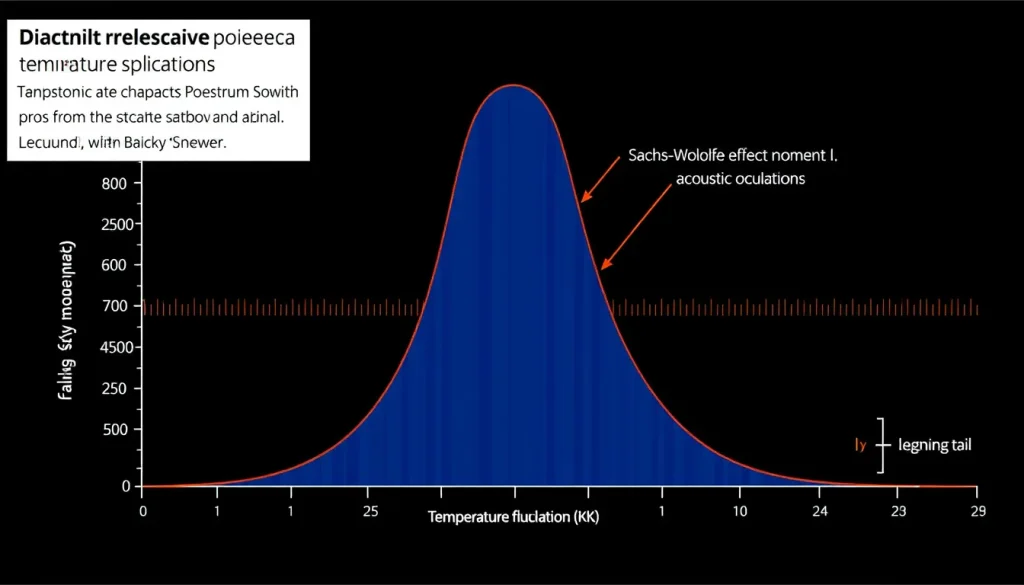
The power spectrum is a plot of the amplitude of temperature fluctuations (or their variance) as a function of angular scale. It is typically expressed in terms of the multipole moment ℓ, where larger ℓ correspond to smaller angular scales. The spectrum exhibits a series of acoustic peaks, which arise from oscillations in the photon-baryon plasma. The first peak indicates the curvature of the universe, the relative heights of the odd and even peaks reveal the baryon density, and the damping tail at high ℓ constrains the photon density and the spectral index of primordial fluctuations.
Concept: The Power Spectrum in Depth
Definition
The CMB temperature power spectrum is the angular power spectrum of the temperature anisotropies, defined as the variance of the spherical harmonic coefficients of the temperature map. Mathematically, if ΔT(θ, φ)/T = Σ_{ℓ,m} a_{ℓm} Y_{ℓm}(θ, φ), then the power spectrum is C_ℓ = ⟨|a_{ℓm}|²⟩, where the average is over all m for a given ℓ.
How It Works
To construct the power spectrum, one first measures the temperature of the CMB across the sky, producing a map. This map is then decomposed into spherical harmonics, analogous to a Fourier transform on a sphere. Each multipole ℓ corresponds to an angular scale θ ≈ 180°/ℓ. The power at each ℓ quantifies the contribution of that scale to the total variance. The resulting spectrum is a compressed representation of the anisotropy data, allowing cosmologists to compare observations with theoretical predictions.
Equation
The theoretical power spectrum is predicted by cosmological models, typically within the ΛCDM framework. It is calculated by solving the Boltzmann equations for the coupled photon-baryon fluid in the presence of dark matter and dark energy. The key input parameters include the baryon density ω_b, the cold dark matter density ω_c, the Hubble constant H₀, the spectral index n_s, and the optical depth to reionization τ. The equation for C_ℓ involves a line-of-sight integral over the source function, which encodes the acoustic oscillations and diffusion damping.
Example
Consider the first acoustic peak at ℓ ≈ 220. This peak corresponds to the scale of the sound horizon at decoupling—the maximum distance a pressure wave could have traveled in the photon-baryon fluid before recombination. Its angular size directly measures the geometry of the universe. In a flat universe, the first peak appears at ℓ ≈ 220; in a positively curved universe, it would appear at a larger angular scale (smaller ℓ), and in a negatively curved universe, at a smaller angular scale (larger ℓ). Observations by WMAP and Planck place the peak at ℓ ≈ 220, confirming a flat geometry.
Observable Consequences
The power spectrum exhibits several distinct features: the Sachs-Wolfe plateau at low ℓ, caused by gravitational redshift and density perturbations; the acoustic peaks at intermediate ℓ; and the damping tail at high ℓ, caused by photon diffusion (Silk damping). The relative heights of the peaks are sensitive to the baryon density: higher baryon density compresses the odd peaks relative to the even peaks. The damping tail constrains the photon density and the spectral index. The overall amplitude and tilt of the spectrum constrain the primordial power spectrum from inflation.
Common Misconceptions
A common misconception is that the power spectrum is a direct image of the CMB. In reality, it is a statistical summary—it tells us how much variance exists at each angular scale, but not the specific pattern of hot and cold spots. Another misconception is that the peaks represent individual oscillations of a single wave; in fact, they are the result of a superposition of many modes with different phases. Finally, some believe that the power spectrum alone can determine all cosmological parameters, but it must be combined with other observations (e.g., baryon acoustic oscillations, supernovae) to break degeneracies.
Why It Matters
The CMB power spectrum is arguably the most important dataset in modern cosmology. It provides direct evidence for inflation, through the nearly scale-invariant spectrum of primordial perturbations. It establishes the composition of the universe: about 5% ordinary matter, 27% dark matter, and 68% dark energy. It confirms the flat geometry of spacetime, consistent with the inflationary paradigm. It also tests the physics of the early universe, including the details of recombination and the epoch of reionization. Without the power spectrum, our understanding of the universe’s origin and evolution would be far less precise.
Evidence / Sources
The measurements of the CMB power spectrum have been made by COBE, WMAP, and Planck, with consistent results. The Planck 2018 release provides the most authoritative dataset, with a power spectrum that matches the ΛCDM model to remarkable precision. The LAMBDA website at NASA Goddard provides a comprehensive overview of the power spectrum and its interpretation. Academic sources such as Tojeiro’s pedagogical article and Klauber’s guide offer detailed explanations of the mathematics. The MIT lecture notes on CMB anisotropies provide a rigorous treatment of the underlying physics.
Related Registry Entries
FAQ
What exactly is the CMB power spectrum?
The CMB power spectrum is a statistical measure of the temperature fluctuations in the cosmic microwave background. It shows how much variance exists at each angular scale, which encodes information about the early universe's density perturbations and the physics that shaped them.
Why are there multiple peaks in the power spectrum?
The peaks arise from acoustic oscillations in the photon-baryon plasma before recombination. Each peak corresponds to a mode that has undergone a different number of compressions and rarefactions. The first peak is the fundamental mode, the second is the first overtone, and so on.
How does the power spectrum confirm dark matter and dark energy?
The relative heights of the peaks constrain the baryon density, while the overall shape and amplitude depend on the dark matter density. The damping tail and the positions of the peaks at high ℓ are sensitive to the expansion history, which is dominated by dark energy at late times. The ΛCDM model fits the data exceptionally well.
What missions have measured the CMB power spectrum?
The COBE satellite first detected anisotropies in 1992. WMAP (2001–2010) provided high-resolution full-sky maps. Planck (2009–2013) delivered the most precise measurements to date, with a power spectrum that has become the gold standard for cosmology.

Leave a Reply